Precious metals are booming right now – but is it better to invest in gold or silver? Gold is up 36% in the past year. Silver has climbed nearly 130% in the same window. Returns don’t tell you everything you need to know about gold vs silver investing, though.
Both have outperformed cash and bonds over the past decade, and the truth is, you don’t have to pick one or the other. We’re going to cover everything you need to know about investing in gold vs silver, and show you how you can always find the best silver or gold stocks at any given time with VectorVest’s stock advisory.
Fast Facts on Gold vs Silver Investing
| Gold | Silver | |
| Price (May 2026) | $4,562/oz | $77.50/oz |
| 50-Year Return | 34x | 18x |
| 10-Year Return | 4x | 5.5x |
| Volatility | Lower | 2-3x higher than gold |
| Industrial Demand | Minimal | Over 50% of total demand |
| Safe Haven Strength | Strong | Moderate |
| Entry Cost | High per ounce | Low per ounce |
Benefits of Investing in Gold
Gold is considered a safe haven for a reason. Central banks across the world hold it as a reserve asset. You can rely on that institutional backing as a price floor. Gold tends to hold steady or even climb when equity markets sell off. It’s a good hedge against stocks – one of the few assets that genuinely serves as portfolio insurance.
The long-term numbers back it up. Gold has returned roughly 34x on invested capital over 50 years. That track record is gold’s strongest argument if you’re weighing gold vs silver investing. It won’t deliver explosive growth, but it’s not going to collapse during a downturn either.
We have a great resource covering the best gold stocks to buy right now – but let’s take a closer look at the other half of our gold vs silver investing guide.
Benefits of Investing in Silver
Silver has a unique dual identity that differentiates it from gold, in that more than half of all silver demand comes from industry. That means it’s actually used for a specific purpose, whereas gold is seen as more of a store of wealth.
Solar panels alone consume massive quantities of silver, and the electronics and automotive sectors rely on it as well. Silver prices respond to manufacturing cycles and economic growth, not just investor sentiment. That could be a good or bad thing depending on how the market moves. Right now, it’s a blessing for silver investors.
The lower per-ounce price also opens the door for investors who can’t commit the capital gold requires. Silver has returned roughly 5.5x compared to gold’s 4x over the past decade.
The catch? You need to have the stomach for volatility. Daily price swings can be 2-3x wider than gold’s, which scares some investors off. The thing is, though, those swings have rewarded the investors who weathered the storm.
Silver is the metal that rewards a longer leash when it comes to investing in gold vs silver. So, where does that leave you – is it better to invest in gold or silver RIGHT NOW?
Is it Better to Invest in Gold or Silver?
As you can imagine, there’s no one-size-fits-all answer to investing in gold vs silver. Your risk tolerance and investment timeline both shape the decision. The current market outlay will factor into your decision as well, and that’s something that constantly evolves.
In general, though, gold works for investors who want protection. It holds value during downturns, doesn’t depend on industrial demand cycles, and behaves more like insurance than a growth play. Go with gold if you’re preserving wealth you’ve already built. On the other hand, silver suits investors who are willing to sit through more volatility in exchange for higher upside.
So, is it better to invest in gold or silver? Like we said from the get-go, it doesn’t have to be either-or. Experienced investors tend to hold both. Gold anchors the portfolio while silver leaves room for growth. You need the capital for each, but assuming you have it, you should consider diversifying.
How Do You Invest in Gold and Silver?
There are numerous ways you can go about investing in gold and/or silver. It all depends on your specific situation – how much capital you have, your risk tolerance, your investment horizon, and a few other factors.
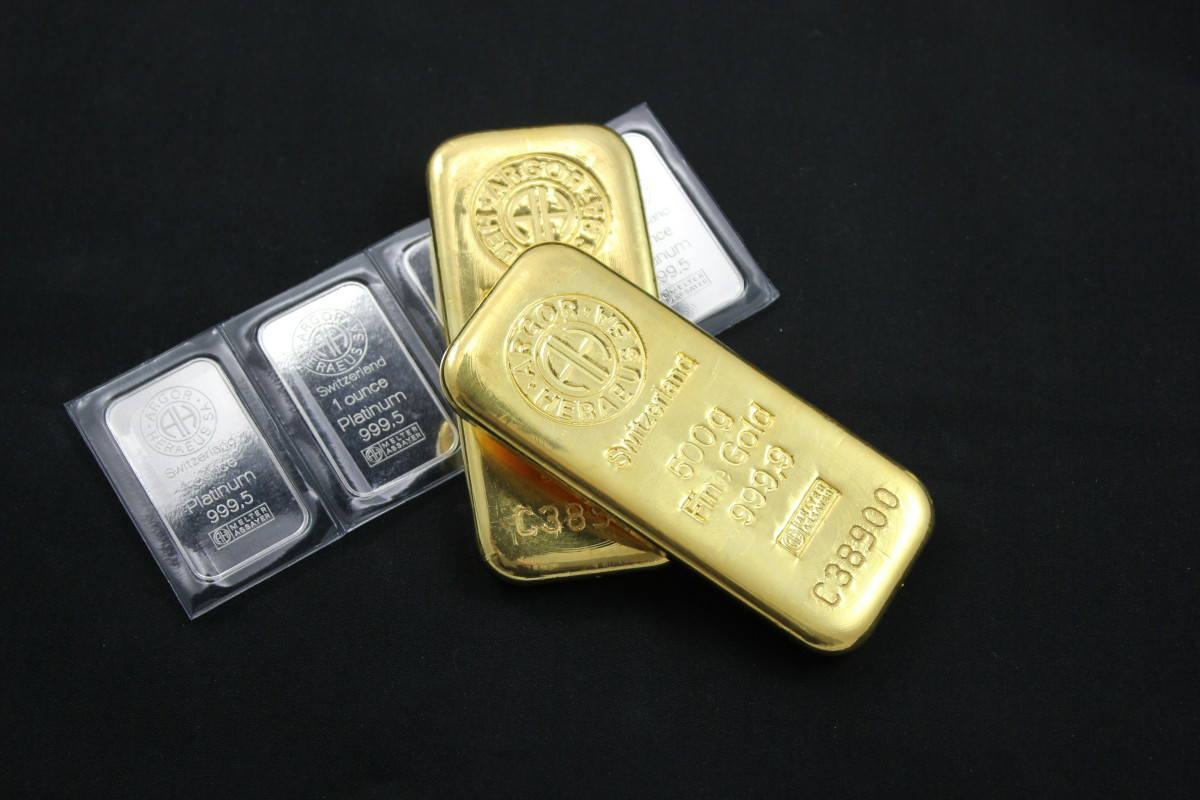
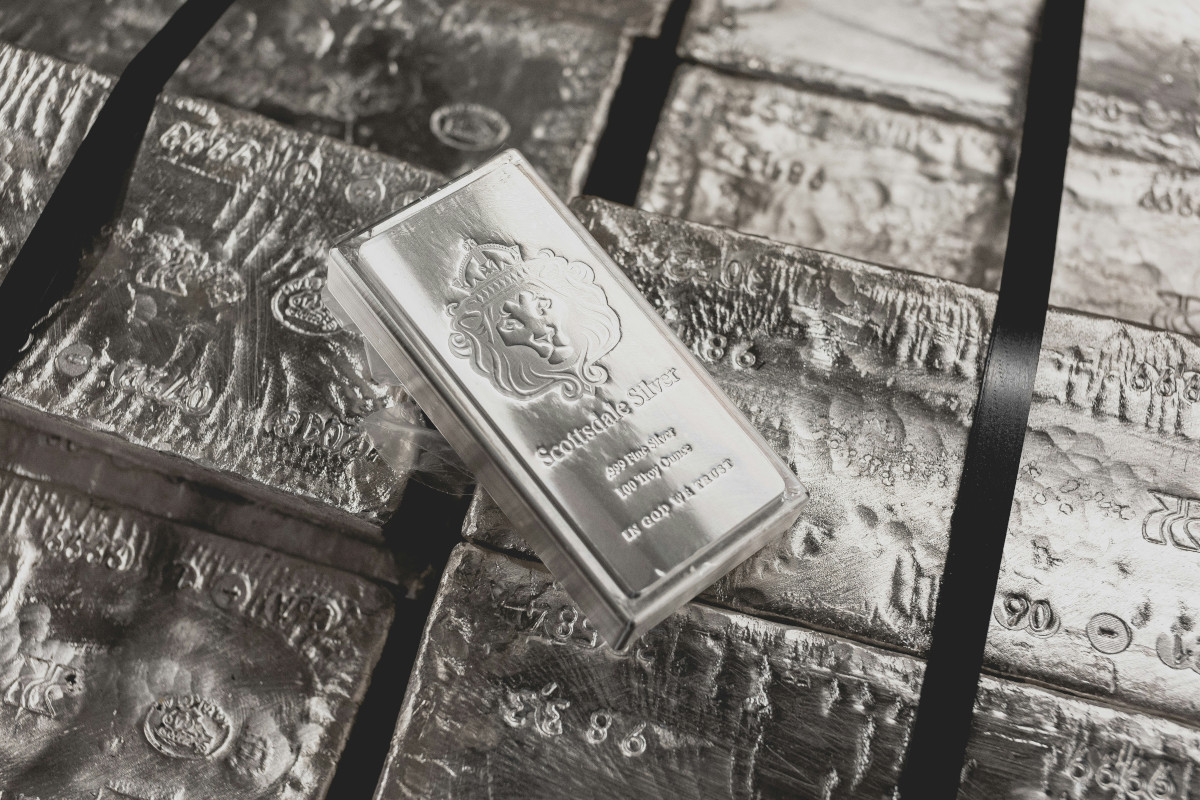
Physical Metal
Physical bars and coins are actually not the best way to go about it. Yes, you own the metal outright – but that means you have to store it and find a way to sell when prices hit your target. Storage costs and dealer spreads eat into returns, so factor those into your calculations before buying.
ETFs
Gold and silver ETFs track spot prices and trade on major exchanges like any stock. The choice between a gold ETF vs gold mining stocks depends on whether you want direct metal exposure or leveraged exposure through a company’s operations and margins. Investors who are willing to put in a little more work will find that owning the individual stocks themselves is the better play.
Mining Stocks
Yes, mining stocks have the most risk – but they also have the most potential for an investor. A gold miner that’s growing production while bringing costs down can dramatically outpace the metal itself.
Knowing where to buy gold stocks and how to evaluate them separates a speculative bet from an informed position. That’s where VectorVest comes into play. It’s a stock forecasting software that analyzes over 18,000 stocks daily and delivers a clear buy, sell, or hold recommendation on every one. The system has outperformed the S&P 500 by 10x over 22 years.
Final Words on Investing in Gold vs Silver
Gold vs silver investing doesn’t have to mean choosing one and ignoring the other. Gold holds its value when markets get rough, and silver brings you a little more upside tied to real economic demand. Find the right mix based on your risk tolerance and time horizon.
Just remember, VectorVest gives you the data to decide with confidence whether you’re comparing gold miners to silver ETFs or looking for the best stocks to invest in across any sector. Get a free stock analysis today and see how it works!
Frequently Asked Questions
Is it better to invest in gold or silver right now?
Silver has the momentum edge right now, as it has returned around 5.5x over the past decade compared to gold’s 4x, thanks in part to industrial demand from solar and electronics. Gold is safer but currently priced near all-time highs.
Has silver ever been a better investment than gold?
Yes. Silver outperformed gold on a percentage basis over the last 10 years (5.5x vs 4x). It also spiked harder during the 2020-2021 recovery.
What makes gold more valuable than silver?
Gold is rarer, central banks hold it as a monetary reserve, and it’s been treated as money for thousands of years.
Related Resources
Best Rare Earth Stocks | Best Lithium Stocks | Overweight stock meaning


Leave A Comment