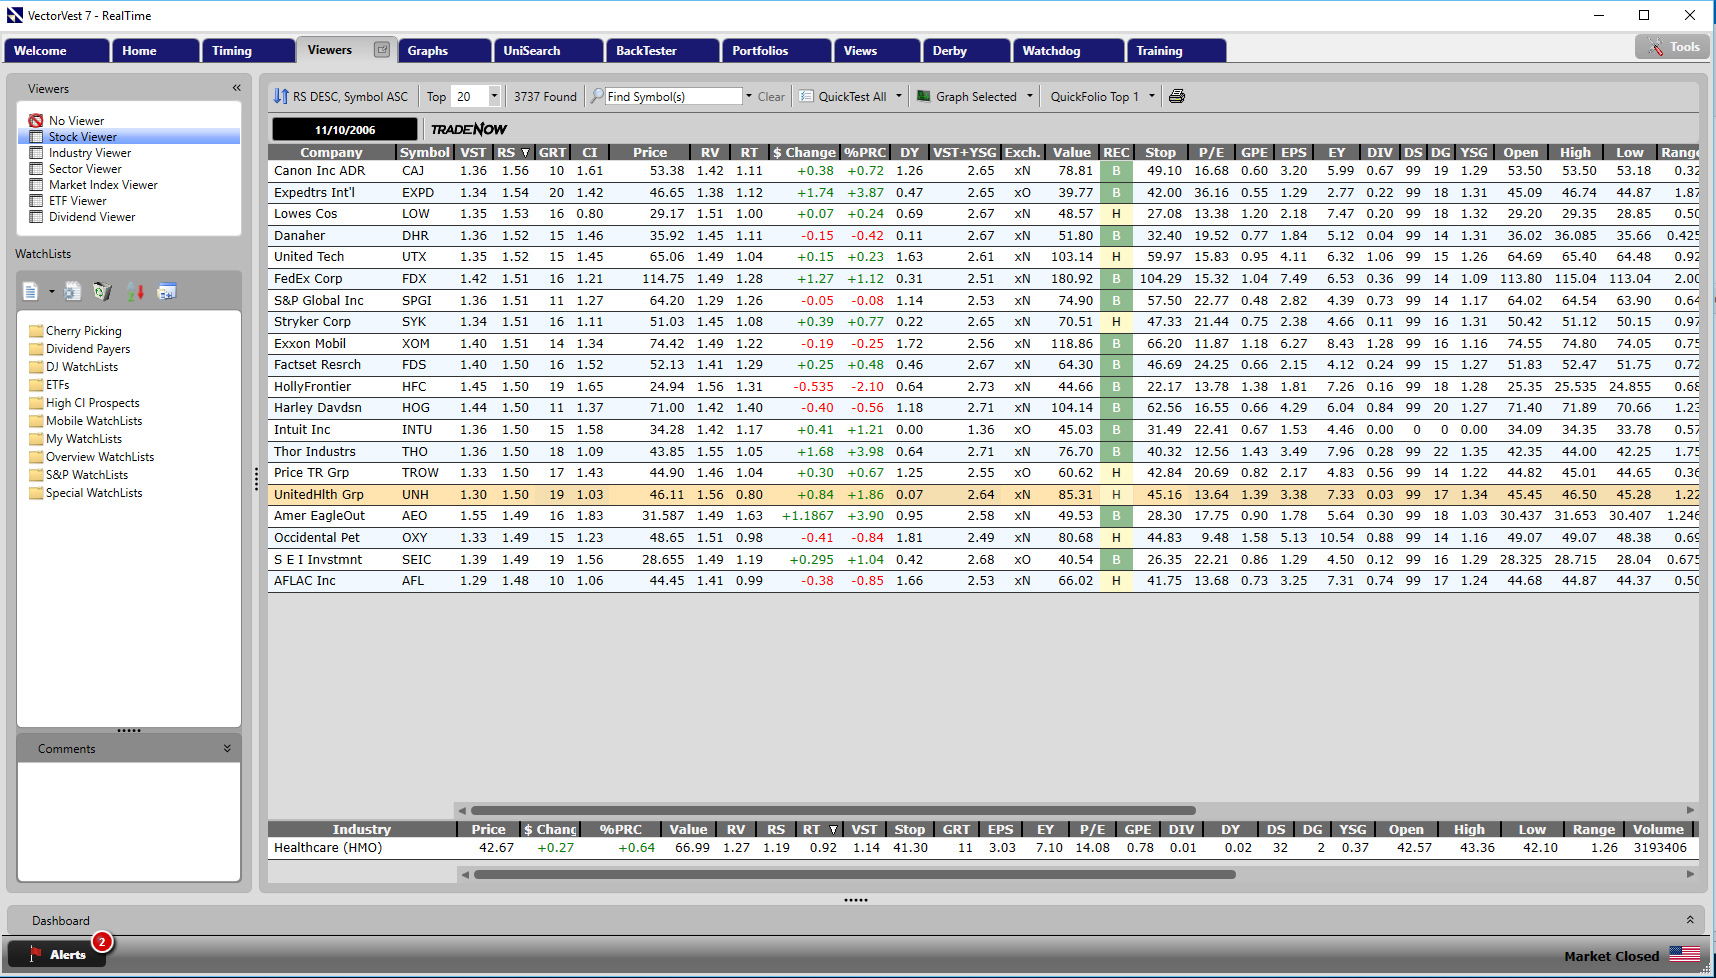
Click image to enlarge
You have probably heard the story about the guy who was called in by the IRS to have his tax return audited. When he showed up at the IRS’s office, he carried two large shopping bags of check stubs, receipts and stuff and dumped them on the auditor’s desk. “Here,” he said, “you figure it out.”
The stock market operates in the same way. It emits a blizzard of data every day which comes in a random, helter-skelter way. Most of it is totally meaningless or unimportant to us as individuals. Some of it is vitally important. We have to figure out which is which. Of course there are hundreds, if not thousands, of experts who claim they have the answers we need. So we get another blizzard of theories, analyses and interpretations of what the data mean. Then we get the forecasts and recommendations derived from the former data, theories, analyses, and interpretations. Half the time, the stuff we hear, see and read is dead wrong and/or misleading. So how can we separate the good advice from the bad?
I use VectorVest. VectorVest is designed to conduct a factual, objective analysis of stock data and transform it into information and guidance. All of this information and guidance is stored in Stock Viewer.
Stock Viewer is a gold mine. Our job is to find the gold contained therein and extract it. This is not hard to do. I simply access Stock Viewer and examine the top 20 stocks ranked by VST-Vector. I look at the graph of each and every one of the top 20 VST stocks, every night. In my essay of 12/03/04, I described what I look for in a graph, i.e., a nice steady pattern of rising prices. I also like to see smooth, steadily rising EPS patterns. You could hardly go wrong buying stocks with steadily rising earnings.
Stocks with the best EPS patterns have high RS ratings. So the next thing I do is sort by RS and look at the graphs of the top 20 RS stocks. In this case, I especially like to look at the “All Weekly” graphs to examine the long-term of earnings performance of these great stocks. EPS is the engine that keeps a stock’s price going higher and higher.
To find stocks with the smoothest Price performance patterns, I’ll sort by Comfort Index, CI. I’ve relocated CI on my Stock Viewer screen to be between VST and GRT. In this way, I know exactly what to expect when I look at a Standard graph of a stock. If the CI is high, above 1.50, I’m going to see stocks with smooth, rising Price performance. I won’t look at a stock’s graph if the CI is low, below 1.00, unless I’m bottom fishing or thinking about shorting the stock. I especially like to look at graphs of high CI stocks that are less than $10.00 in Price.
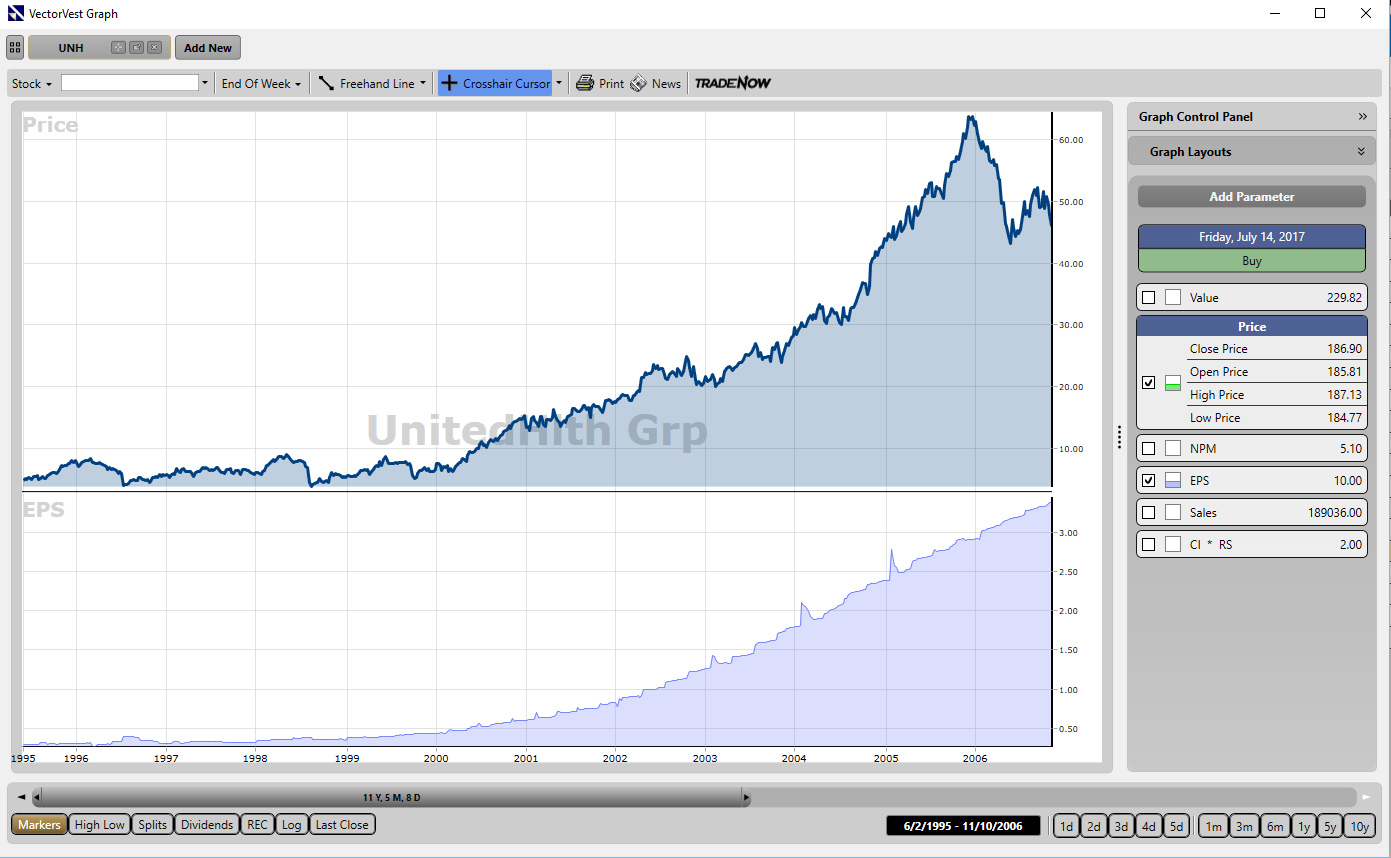
Click image to enlarge
I’ll always sort by $Change to see what’s going on with the big boys. Hmm, yesterday was a big day for gold. GDM was up 44.84 and HUI was up 13.55. The graphs show that both stocks bottomed in early October and seem to be making good moves. The Oil Index, XOI, is moving right along with them. Is this a coincidence?
Speaking of big moves, the next thing I’ll do is sort by %PRC. In this case, I’ll be looking at very low-priced stocks with the largest percent price changes. Most of these stocks are pretty awful, so I’ll only look at “B” rated stocks. Note that as of yesterday, Thursday, November 9th, the top three “B” rated stocks were rebounding from long downturns. The next two were exploding higher. Hey, Trio-Tech Int’l, TRT, up 20.87%, is in our Summer Hiatus Portfolio. Go man, go! The next “B” rated stock on this screen, Dana corp., DCNAQ, may be coming out of its grave.
Next I’ll sort by DY. Oh, do I love this sort. Take a look at Morgan SDW EEU, RNE. It’s a high income Closed-end Fund selling for $36.66 a share and paying an $11.43 dividend for a juicy 31.18% yield. The graph shows it was as high as $53.60 before the May drawdown and is now rising from a $28.82 bottom. One of the things I like to do with this sort is find high yielding, optionable stocks. So I’ll buy the stock and sell at-the-money Calls against it. That way I’ll collect the fat dividend from the stock and the premium from the short Calls. Managing this trade is not as easy as it sounds, so be careful if you want to try it.
There’s more that I do with Stock Viewer and a whole lot more I can share with you. For now, however, that’s How I Use Stock Viewer.
What you should do next…
- Get our latest blogs delivered right to your inbox, subscribe to our newsletter.
- The market moves fast! Get our most current evaluation of this stock with our FREE stock analysis tool.
- Looking for stock picks? Not sure if now is the right time to buy/sell? For a limited time, enjoy the full benefits of a 30-day subscription to VectorVest for only $9.95 (usually up to $139/month) . Get access to our full list of screeners showcasing our top stock picks that tell you exactly what to buy, when to buy, and when to sell.


Leave A Comment