A Performance Graph allows you to see the performance of any Stock, Industry, or Sector compared to any other Stock, Industry, or Sector. The graph presents the percentage change from the first point on the graph.
Accessing the Performance Graph:
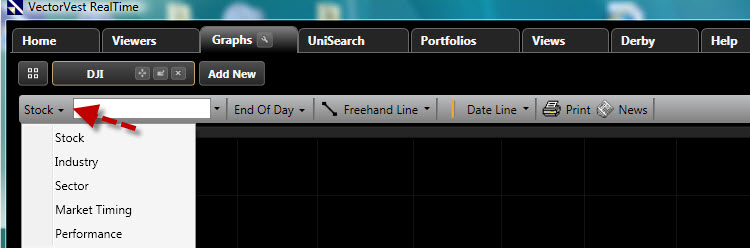
Access RealTime Graphs by clicking the Graphs Tab on the Main Menu Toolbar.
Click the Graph Type Selector then choose Performance.
Adding Items to the Performance Graph:
Use the drop down selection boxes found in the Parameter List to add items to the graph. The Parameter List can be located on the right, or left of the graph screen, depending on your Default Graph Choices.
Removing Items from the Performance Graph:
To remove items from the Performance Graph, uncheck the selection box next to the item found in the Parameter List, or click on the item in the Parameter List, and choose 'Remove Item'.