Each and every day in the VectorVest Views, we analyze the movement of the VVC price, RT and the Buy/Sell Ratio. These three factors are combined into a master indicator, called the Market Timing Indicator (MTI). The Market Timing Graph is a graphical representation of this analysis, which you may work with much like any standard VectorVest RealTime Graph.
Accessing the Market Timing Graph:
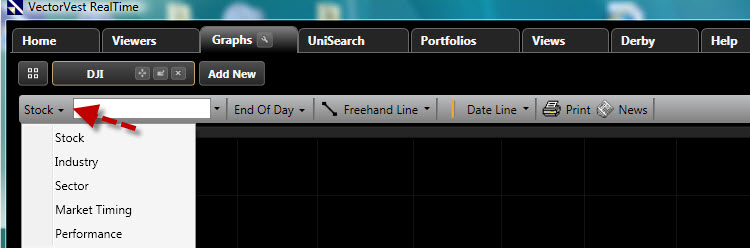
Access RealTime Graphs by clicking the Graphs Tab on the Main Menu Toolbar.
Click the Graph Type Selector then choose Market Timing.