The Portfolio MiniGraph allows you to track the price performance of any portfolio created in VectorVest RealTime.
This Gadget is customizable. Left-click the Settings Icon to display the Portfolio MiniGraph Toolbar.
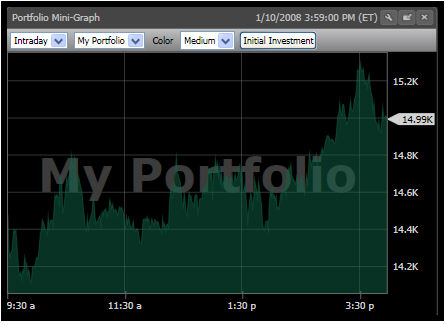
Portfolio Mini Graph Toolbar Settings (Located on the HomePage & Dashboard):
Data Type: The first selection box on the Portfolio MiniGraph Toolbar allows you to select from Intraday or EOD (End of Day) data. By default, Intraday will be selected.
Portfolio Selector: The second selection box on the Portfolio MiniGraph Toolbar allows you to select which portfolio to track. By default, the first portfolio listed on the Portfolios tab will be displayed. Note: You must create a portfolio using the Portfolios Tab before it can be selected from the list. you can add multiple Portfolio MiniGraphs to the HomePage and Dashboard.
Color: Click to choose the color of the Portfolio MiniGraph.
Size: The third selection box can be used to change the size of the Portfolio MiniGraph Window. Selections include Small, Medium, and Large. By default, Medium will be selected.
Initial Investment: Click this button to display or hide a graph marker to mark the initial investment amount used to start the portfolio. This marker will be selected by default.
Show Change: Click to display a watermark representing the dollar and percent change of the portfolio.