The Portfolio MiniGraph displays the current status of your portfolio.
.
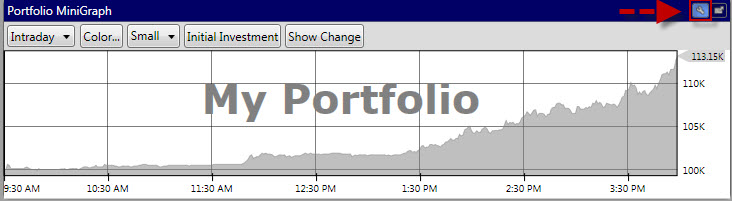
Customizing the Portfolio MiniGraph (Portfolio Tab):
Click the Settings Icon to display the Portfolio Mini Graph Toolbar
Graph Span: The first selection box on the Portfolio Mini Graph Toolbar allows you to select from Intraday or EOD (end of day)data. By default, Intraday will be selected.
Change Series Color: Click to choose the color of the shaded area on the Portfolio Mini Graph.
Size of Graph: Select small, medium or large to change the size of the graph.
Initial Investment: Click this button to display a graph marker for your initial investment. By default, this marker will be selected.
Show Change: Click this button to display the amount your portfolio has increased or decreased..
Detaching the Portfolio MiniGraph:
To detach the Portfolio MiniGraph click the detach icon to the right of the Settings icon.