Graphing Industries Using the Main Menu Bar:
Access RealTime Graphs by clicking the Graphs Tab on the Main Menu Toolbar.
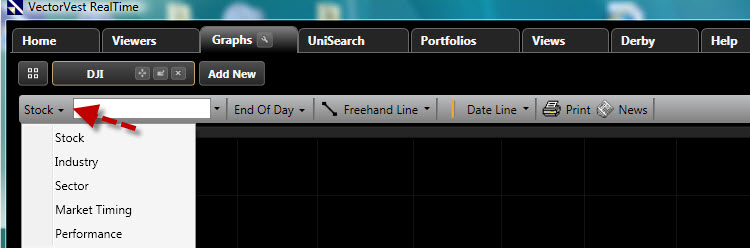
Click the Graph Type Selector, then choose Industry Graph.
Choose the Industry you wish to view from the selection box to the right of the Graph Type Selector.
Graphing Industries Using the Local Toolbar:

Access the Industry Viewer.
Left-click the Industry, or Industries, you wish to select or tag multiple records.
Left-click the drop down arrow beside the Graph Button.
Choose All, Selected, or Top #. Choosing Select All will graph all the records visible on the Viewer Screen, Selected will only graph the stocks you have tagged, and Top will graph the number of stocks you enter in the window.
Your Graph choice will saved, and you can repeat the same graph selection just by clicking the Graph Button. You may also access the Graph feature by selecting a record, then right-clicking and choosing View Graph from the Options Menu, or by using the Graph Tab.
Graphing Industries Using the Options Menu:
Access the Stock Viewer, Industry Viewer, ETF Viewer, Market Index Viewer, Watchlist, QuickList or UniSearch.
Left-click the record you would like to graph or tag multiple records.
Right-click on the selected record.
Select "View Industry Graph" from the Options Menu that appears.