Discover the benefits of world-class stock analysis and market guidance.
VectorVest is a simple source for market guidance
that helps you make money in the stock market.
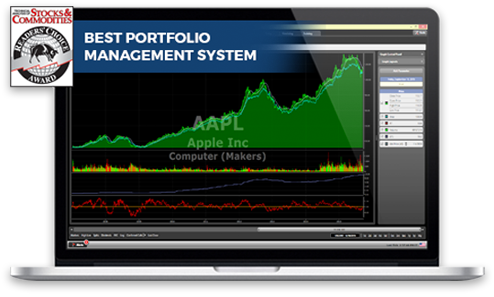
VectorVest is the only stock analysis and portfolio management system that analyzes, ranks and graphs over 16,500 stocks each day for value, safety and timing and gives a clear buy, sell or hold rating on every stock every day.
VectorVest gives you ANSWERS, not just data. What to buy. What to sell. Most importantly, WHEN. Unbiased, independent answers. Investment guidance provided at a glance or through your own analysis.
How can something so complicated be that simple?
For over 40 years, VectorVest has been creating mathematical models to clearly define EXACTLY what causes a stock’s price to rise or fall. No opinions or guesswork. Just math.
It can all be summed up in three mathematical models: value, safety and timing (VST). VectorVest rates Value, Safety and Timing the same: it starts at 1.00, and ranges from 0.00 To 2.00.
Take Relative Value (RV): Anything above 1.00 is worth looking at. Anything below 1.00 is a red flag. Stocks with ratings higher than 1.00 have above average appreciation potential. If it were below average, you’d be better off in AAA corporate bonds.
Relative Safety (RS): Tells you how stable a stock is compared to other investments. Again, if the stock is above 1.00, it’s safer and more predictable than other stocks. If it’s risky and unpredictable, the rating will be below 1.00.
Finally, Relative Timing (RT): How does the short-term price performance look? Above 1.00 is good, below 1.00 is risky, and if the price trend is flat, it just gets a 1.00.
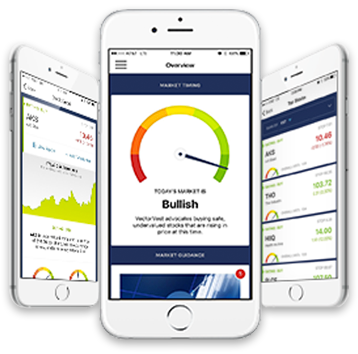
The result is a system for stock market trend analysis using value, safety and timing (VST) to create clear BUY, SELL and HOLD signals that direct investors to rising stocks, in rising sectors and markets. No guesswork. No gut feelings.
Deciding is simple. Choose the stock with the highest VST.
We Keep Good Company
VectorVest has been featured in and partners with stock market industry leaders.
VectorVest is a simple source for market guidance
that helps you make money in the stock market.
VectorVest is the only stock analysis and portfolio management system that analyzes, ranks and graphs over 16,500 stocks each day for value, safety and timing and gives a clear buy, sell or hold rating on every stock every day.
VectorVest gives you ANSWERS, not just data. What to buy. What to sell. Most importantly, WHEN. Unbiased, independent answers. Investment guidance provided at a glance or through your own analysis.
How can something so complicated be that simple?
For over 40 years, VectorVest has been creating mathematical models to clearly define EXACTLY what causes a stock’s price to rise or fall. No opinions or guesswork. Just math.
It can all be summed up in three mathematical models: value, safety and timing (VST). VectorVest rates Value, Safety and Timing the same: it starts at 1.00, and ranges from 0.00 To 2.00.
Take Relative Value (RV): Anything above 1.00 is worth looking at. Anything below 1.00 is a red flag. Stocks with ratings higher than 1.00 have above average appreciation potential. If it were below average, you’d be better off in AAA corporate bonds.
Relative Safety (RS): Tells you how stable a stock is compared to other investments. Again, if the stock is above 1.00, it’s safer and more predictable than other stocks. If it’s risky and unpredictable, the rating will be below 1.00.
Finally, Relative Timing (RT): How does the short-term price performance look? Above 1.00 is good, below 1.00 is risky, and if the price trend is flat, it just gets a 1.00.
The result is a system for stock market trend analysis using value, safety and timing (VST) to create clear BUY, SELL and HOLD signals that direct investors to rising stocks, in rising sectors and markets. No guesswork. No gut feelings.
Deciding is simple. Choose the stock with the highest VST.
Non-Biased Data Driven Investing
For over 40 years, VectorVest has been creating mathematical models to clearly define EXACTLY what causes a stock’s price to rise or fall. No opinions or agenda. Just math.
VectorVest takes the obscurity out of the market and distills it down to what to buy, what to sell and most importantly, WHEN. Unbiased, independent investment guidance.
With VectorVest you can break free of the TV pundits, click bate articles, and self-serving financial advisors. Just unbiased, emotion free investing.

Ever wonder why financial advisors always advocate buy & hold despite market direction? Truth is, financial advisors only earn commissions when you’re in the market. For better or for worse. No one looks out for your best interest better than YOU.
VectorVest believes you should be in control of your future and that your earnings should remain yours. Pay one flat monthly fee for unlimited earnings potential, whether you’re in or out of the market.

Are trades really free? Brokerages may recoup the costs in less transparent ways. Typically they widen the bid/ask spread. You may pay a little bit more than the quoted price when you buy a stock and receive a little less when you sell.
The absence of trading commissions means that less efficient trading could be a way for brokerages to capture revenue from trades in a way that’s less obvious to the customer.
Think of it as free shipping. It says free but the fees are often baked in behind the scenes. VectorVest is always 100% transparent with a flat monthly fee.

Non-Biased Data Driven Investing

No Agenda
For over 40 years, VectorVest has been creating mathematical models to clearly define EXACTLY what causes a stock’s price to rise or fall. No opinions or agenda. Just math.
VectorVest takes the obscurity out of the market and distills it down to what to buy, what to sell and most importantly, WHEN. Unbiased, independent investment guidance.
With VectorVest you can break free of the TV pundits, click bate articles, and self-serving financial advisors. Just unbiased, emotion free investing.

No Commissions
Ever wonder why financial advisors always advocate buy & hold despite market direction? Truth is, financial advisors only earn commissions when you’re in the market. For better or for worse. No one looks out for your best interest better than YOU.
VectorVest believes you should be in control of your future and that your earnings should remain yours. Pay one flat monthly fee for unlimited earnings potential, whether you’re in or out of the market.

No Hidden Fees
Are trades really free? Brokerages may recoup the costs in less transparent ways. Typically they widen the bid/ask spread. You may pay a little bit more than the quoted price when you buy a stock and receive a little less when you sell.
The absence of trading commissions means that less efficient trading could be a way for brokerages to capture revenue from trades in a way that’s less obvious to the customer.
Think of it as free shipping. It says free but the fees are often baked in behind the scenes. VectorVest is always 100% transparent with a flat monthly fee.


We Keep Good Company
VectorVest has been featured in and partners with stock market industry leaders.

