The Program Settings Window enables you to set the default selections used for the Home Page, Dashboard, Graphs, Portfolios and Quickfolios. You may also change the Program's color scheme from this window.
Accessing the Program Settings Window:
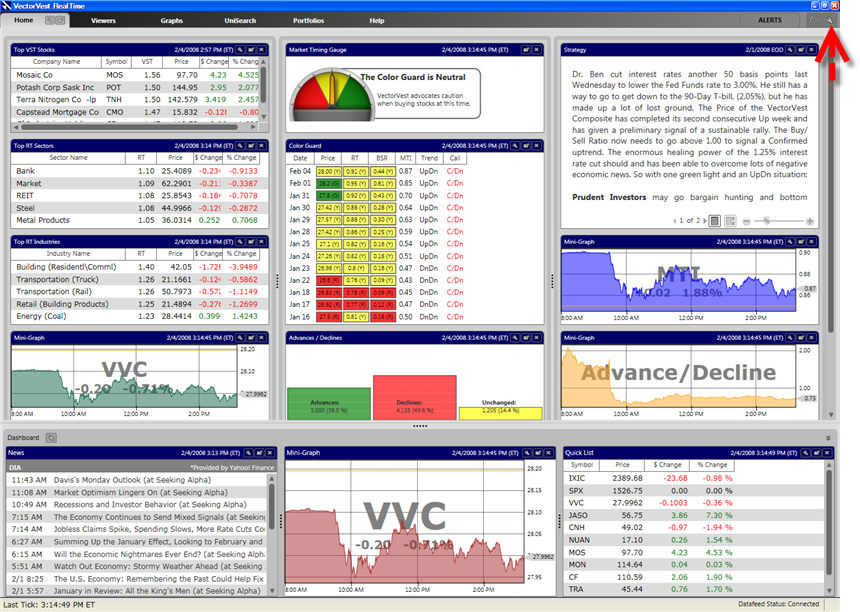
Click the Settings Icon, located next to the Alerts Button, in the top right corner of the program.
Using the Program Settings Window:
The Program Settings Window has three main tabs. Click the desired to tab to make your selections.
Any changes made in the Program Settings Window will not take affect until the Apply or OK Button is clicked.
Each Tab includes individual options for restoring selections to the original VectorVest layout, but the Restore Defaults Button, located at the bottom left of the Program Settings Window, will restore all the original options for all the tabs, with the exception of the HomePage and Dashboard Layouts.
Clicking OK or Cancel will close the Program Settings Window.
The General Settings Tab:
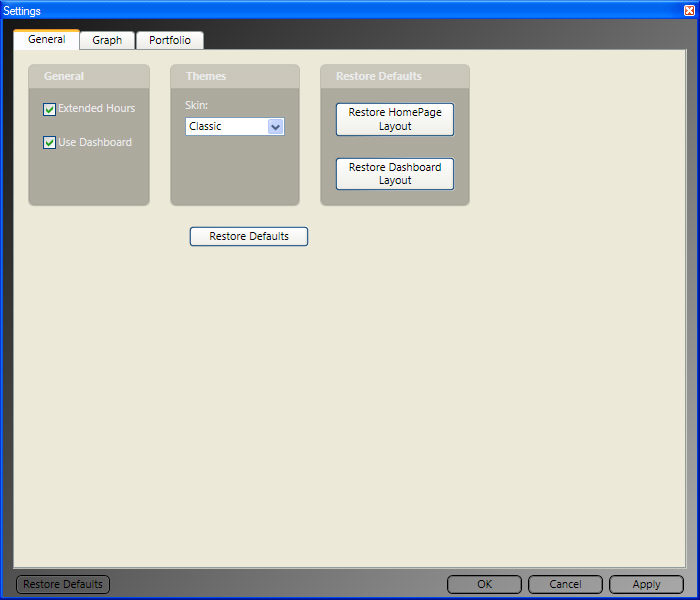
The General Settings Tab allows you to set the default selections used for themes, extended hours, and displaying or hiding the dashboard. This tab will also allow you to restore the HomePage and/or Dashboard to the original VectorVest layout.
To access the General Settings Tab, first access the Program Settings Window by clicking the Settings Icon, located next to the Alerts Button, in the top right corner of the program. The Program Settings Window will open with the General Tab displayed. Click "Apply" to complete any changes.
Extended Hours: This option will display trading information that occurs prior to the market open (8:00 AM-9:30 AM EST), and after the market close (4:00 PM-6:30 PM EST). To display extended hours information, click the selection box next to Extended Hours. Uncheck the selection box to hide extended hours information. By default, the extended hours information will not be displayed. How do I view extended hours, display extended hours, show extended hours.
Display/Hide the Dashboard: This option allows the user to remove the Dashboard from the bottom of their screen. To disable the Dashboard, remove the check mark from the selection box next to Use Dashboard. By default, the dashboard will be displayed and may be hidden or minimized at any time by using the show/hide arrows, or clicking on the Dashboard Title Bar. Turning off the dashboard, disabling the dashboard, hiding the dashboard, displaying the dashboard.
Changing Program Themes: Themes are color schemes that the user can apply to VectorVest RealTime. Separate themes may be chosen for graphs, viewers, and/or the entire program. By default, the selected color scheme for the program is RealTime. This color scheme may be changed by using the drop down arrow next to the selection box to choose a different theme. The Classic theme uses a white display background, while the RealTime theme uses a black display background. Selecting individual colors for Viewers or Graphs, will result in a Custom theme. editing themes, changing color schemes, program colors, using skins, selecting skins or themes.
Restore the Default Theme: Clicking the Restore Defaults Button, located directly below the Theme selection box will restore the program theme to RealTime.
Restore the HomePage Layout: This button will restore the HomePage to the original VectorVest layout. Click "Restore HomePage Layout", then click "Yes" to confirm the change, or "No" to cancel. Restoring the HomePage, resetting the HomePage..
Restore the Dashboard Layout: This button will restore the Dashboard to the original VectorVest layout. Click "Restore Dashboard Layout", then click "Yes" to confirm the change, or "No" to cancel. Restoring the Dashboard, resetting the HomePage.
Default Graph Settings:
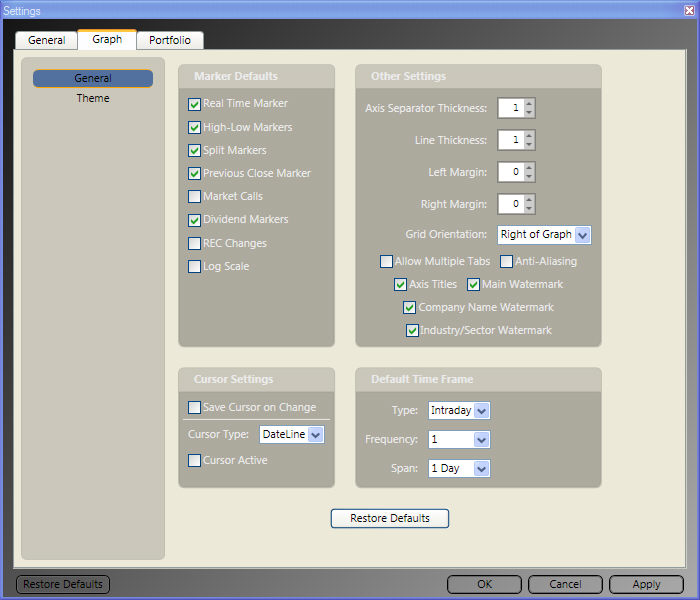
Default Graph Settings allow you to set default selections for graph themes, markers, cursors, time frames, and more.
To access the Default Graph Settings Tab, first access the Program Settings Window by clicking the Settings Icon, located next to the Alerts Button, in the top right corner of the program, then click the Graph Tab. you may also access these settings by clicking the Graph Tab on the Main Menu Bar, then clicking the Settings Icon next to the right of the Tab Label.
Markers: Graph Markers bring significant information to the user's attention. There are eight markers included in the VectorVest Program, including Real Time, High-Low, Splits, Previous Close, Market Calls, Dividends, REC Changes, and Log Scale.
To choose default graph markers, click in the selection box next to the graph marker(s) you would like to be automatically displayed on the graph. Click "Apply" to complete any changes. For a complete description of each marker, click Graph Markers.
Other Settings: Other Settings allow the user to enable multiple graph tabs, as well as change several display aspects that affect the graph margin, line thickness, menu orientation, scaling, and labels. Click "Apply" to complete any changes.
Axis Separator Thickness will determine the width of the lines that separate the main graph and the sub graphs. Click the up arrow to increase the thickness of the graph separator, and the down arrow to decrease it. The default thickness is set to 1.
Line Thickness will change the width of the actual parameter displayed on the graph. Click the up arrow to increase the thickness of the parameter shown, and the down arrow to decrease it. The default thickness is set to 1. This setting is only applicable for line graphs.
Right Margin allows you to specify an empty area at the right edge of the graph to clearly delineate the last viewable data point. Click the up arrow to increase the right margin, and the down arrow to decrease it. The default margins are set to 0 so the graph will be displayed from edge to edge.
Grid Orientation will change whether the Parameter List is displayed on the right or the left side of the graph. The VectorVest default display is Right of Graph. To change this selection, use the drop down arrow to select Left of Graph. When viewing a graph, the Parameter List can be completely hidden by using the show/hide arrows.
Allow Multiple Tabs enables you to use separate tabs when graphing securities. Each tab may then be detached from the main program. This feature also activates Multi-pane View, which allows you to view up to four side-by-side graphs, in a single window. To enable this option, check the selection box next to Allow Multiple Tabs. This setting is not selected by default.
Anti-Aliasing will improve the appearance of the lines displayed on a graph, but may result in decreased display speed. To choose this option, check the selection box next to Anti-Aliasing. This setting is not selected by default.
Axis Titles label the parameters displayed in the graph, and sub-graph(s). For example, Price, RT (Relative Timing), and Volume are displayed by default, the axis title would be located at the top left corner of each graph section. This setting is already selected by default. To hide the axis titles, uncheck the selection box next to Axis Titles.
Watermarks are displayed in the background of each graph to provide the ticker symbol (main watermark), company name, and industry/sector information. All watermark labels are displayed by default. To hide a watermark, uncheck the selection box next to the desired watermark.
Cursor Settings: Cursor Settings allow the user to choose the type of cursor that is initially displayed for use on the local toolbar of each graph. By default, the dateline cursor is selected. Also by default, this cursor will not be active, i.e. displayed on the graph. To activate a cursor by default, read the options listed below. Click "Apply" to complete any changes.
Save Cursor on Change remembers and activates the same cursor that was last selected upon opening each successive graph. Check the selection box next to Save Cursor on Change to use this option.
Cursor Type is not available when Save Cursor on Change is selected. Cursor types include:
Crosshair Cursor: Displays price and time/date information along the vertical and horizontal axis of the graph, respectively. This information is reflective of the close of the day or the close of the bar selected. This is a dynamic cursor that will automatically track and display information based on the movement of your mouse. Additional parameter values will be displayed in the parameter list.
Horizontal Cursor: Displays price information along the horizontal axis of the graph. This is a dynamic cursor that will track and display information based on the movement of your mouse.
Vertical Cursor: Displays time/date information along the vertical axis of the graph. This is a dynamic cursor that will track and display information based on the movement of your mouse. Additional parameter values will be displayed in the parameter list.
DateLine Cursor: Information will be displayed in the Parameter List. This is a static cursor. Left click on the desired data point to display the information for the date/time selected.
Default Time Frame: The Default Time Frame section allows you to customize the default graph options for the type, frequency, and time span of the data displayed. Click "Apply" to complete any changes.
Type allows the user to select from Intraday, End of Day, End of Week, or Weekly data as the initial data type. By default, Intraday data will be selected. To change the selection, click the drop down arrow beside Type and select from the drop down menu.
Frequency allows you to define the number of minutes between data points. This selection is only available for Intraday data. By default, 1 minute will be selected. Click the drop down arrow next to the selection box to select a different default frequency.
Span enables you to choose the amount of data initially viewable on the graph. In addition to numerous predefined time frames, the Best Fit selection will use your monitor's screen resolution to determine the time span needed for optimal display. By default, 1 day is selected. Click the drop down arrow next to the selection box to select a different time span.
Restore Graph Defaults: Click the "Restore Defaults" button, located on the Graph Settings Tab (the button is located in the middle of the Graph Settings Tab, toward the bottom), to restore the program's original default graph selections and colors.
Graph Theme: Themes will allow you to make changes to the colors used in selected areas of the graph, including the background, axes, labels, grid lines, watermarks, extended hours, and market calls. To access graph themes, click "Theme" on the left panel of the Graph Settings Tab. Select a pre-designed theme from the drop down list, or create a custom theme by selecting colors for each of the areas listed. Click the drop down arrow to the right of the area you would like to change and use the chart to select a new color. Click "Apply" to complete any changes.
Default Portfolio Settings:
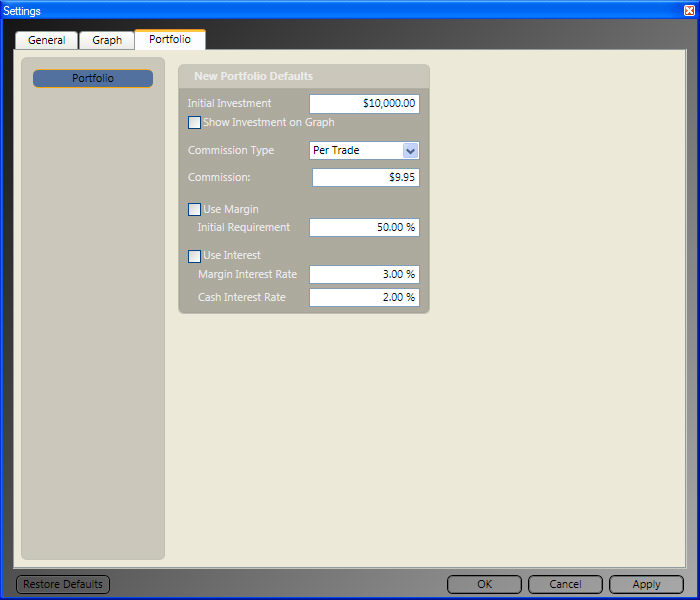
Portfolio Settings allow the user to set the default selections used when creating a new portfolio or QuickFolio. These selections include the initial investment, and selections for commission, margin, and interest. To access the Default Portfolio Settings Tab, first access the Program Settings Window by clicking the Settings Icon, located next to the Alerts Button, in the top right corner of the program, then click the Portfolio Tab. you may also access these settings by clicking the Portfolio Tab on the Main Menu Bar, then clicking the Settings Icon to the right of the Tab Label.
Make your selections for each Portfolio option, then click "Apply" to complete your changes.
Select QuickFolio from the left panel on the Portfolio Settings Tab and make your selections for each of the options listed, clicking "Apply" to complete your changes.