Skip to content
  • 1-888-658-7638
  • Login
VectorVest Logo
  • Products
    • VectorVest
    • Stock Advisory Mobile App
    • Pro Integrations
    • RealTime Derby
    • OptionsPro
    • RoboTrader
    • ProfitLocker Pro
  • Pricing
  • Education
    • Investing 101

      Learn to find the right balance between growth and safety.

      • Events & Webcasts
      • Digital Courses
      • Group Coaching
    • Growth & Income

      Grow your net worth no matter what stage of life.

      • Events & Webcasts
      • Digital Courses
      • Group Coaching
    • Options

      Reduce risk and generate income with options.

      • Events & Webcasts
      • Digital Courses
      • Group Coaching
    • Swing Trading

      Exploit short term trades for extraordinary potential!

      • Events & Webcasts
      • Digital Courses
      • Group Coaching
    • Helpful Resources
      • VectorVest Summit
      • Investment Calculator
      • VectorVest Reviews
  • Company
    • Dr. Bart DiLiddo
    • Media Archive
    • VectorVest Reviews
  • Contact Us
  • Blogs
    • Swing Trading
    • Options
    • Hot Stocks
    • Retirement
  • 30-Day Trial
Previous Next
  • View Larger Image

The Near Perfect Indicator

Traders and investors are always searching for the Perfect Indicator. You know, the Holy Grail that never loses. How do I know? Well, I am one of those people. Sorry, but it doesn’t exist.

All I will say is there are technical indicators that can give you a “Trader’s Edge.” They are mostly trend-following indicators based on price action. If you don’t understand the basics of them, you may be missing an opportunity to improve your “hit rate” and make more money.

Of the widely available indicators, my favorites are Moving Averages, Support and Resistance, MACD, Stochastics, and RSI. I have rule-based strategies built around each one of them.

There is, however, one near-perfect indicator that I use with virtually all of my setups. I recommend it to every trader, especially those who are new to technical analysis and those who don’t have a clear, consistent, and repeatable setup that makes them money more often than not. The indicator is VectorVest’s Relative Timing or RT. VectorVest Founder Dr. Bart DiLiddo has written several Essays about it over the years, and I have written a few myself.

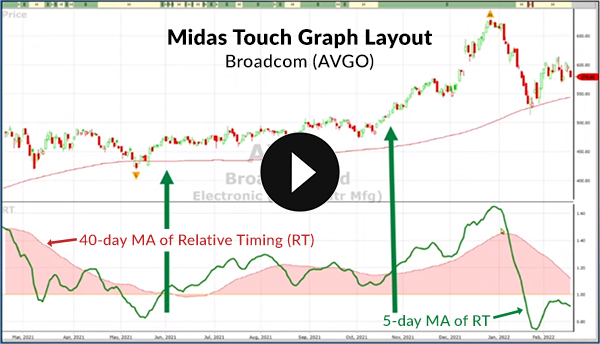
RT is excellent on its own, but more and more I like the 40-day Moving Average of RT, especially in the volatile markets we’re seeing so far this year. It’s an essential part of the Midas Touch Graph layout, but let me explain how you can use it to gain an edge and get into trades precisely when the upside momentum is increasing.

AVGO stock graph

The rules of Market Timing apply. When it is go-time, select the Midas Touch from Graph Layouts in the Graph Control Panel. The 40-day MA of RT will appear on the sub-graph. Display the Price and leave the MA of the Stop Price on the graph. Next, add the 5-day MA of RT to the sub-graph. It is a smoother proxy for the RT. Lastly, make sure the Recommendation, ‘B,’ ‘S,’ ‘H,’ REC ribbon is running across the top of the graph.


Click here to Try VectorVest Risk-Free for 30 Days!

Or call 1-888-658-7638


  1. Here then are my rules for the safest setups to buy:
    The 5-MA of RT has recently crossed above the 40-MA of RT.
  2. The 40-MA of RT has stopped falling and is flattening out or starting to turn up.
  3. For the safest entry, wait for the next Buy REC if there isn’t one already.

That’s it. Once you start looking for this pattern, it will literally jump off the page for you. It will tell you three things:

  1. The trend.
  2. How strong the trend is.
  3. The safest times to Buy and Sell.

Please click here to watch a short video where I will show you the setup and what to look for. Let’s test it out with a couple of well-known stocks.

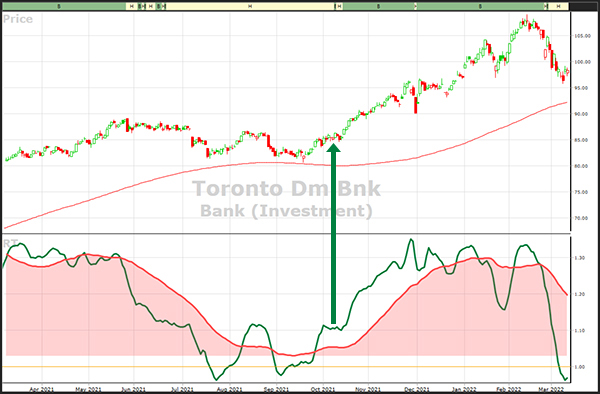
TORONTO DOMINION BANK (TD). The 40-day MA of RT stopped falling and flattened out in mid-September 2021. The 5-day MA of RT crossed the 40-day MA of RT on September 28th. On October 8th, TD got a ‘B’ REC, so you could have purchased it at the next trading day’s open for about $86.28 per share.

You might have sold around January 21, 2022, when both the 5 and 40-day MA of RT started hitting lower highs. Price was about $100 per share for a stress-free gain of about 16%.


Toronto Dm Bnk stock graph

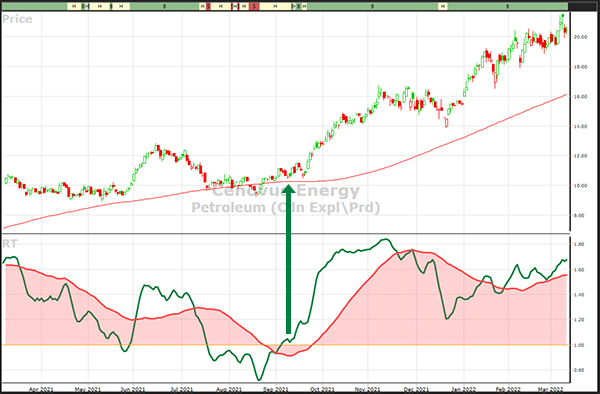
CENOVUS ENERGY (CVE). Cenovus is the top VST stock as of Monday, February 14th, 2022. Before then, the 5-MA of RT crossed above the 40-MA of RT on September 2nd, 2021. When a new Buy signal came on September 13th, the 40-MA of RT was still below 1.00, but had flattened out and was ready for liftoff.

The next day’s opening price was $11.25 per share. By November 30th, both the 5 and 40-day MA of RT were losing momentum, a perfect time to Sell all or at least half of your position. Price was around $15.30 per share, a gain of about 40%. After a brief pullback, Price and the 5-day MA of RT resumed their march higher. In fact, the stock rallied another 40%.

Cenovus Energy stock graph

The beautiful thing about these setups is that they occur frequently, and they are easy to identify. So, here is my challenge. Set up your graph in 1-year daily mode as described above. Study the top 100 VST or RS (Relative Safety) ranked stocks from the Stock Viewer.

Put your Date Line cursor at the setup of the 5 and 40-MA of RT as noted in Rules 1 and 2. If there isn’t already a Buy REC, advance to the nearest signal. Note the possible entry price and then ask yourself, “Did I have a chance to make some money?” Note how many times out of 100 you said, “Yes, I would have made money.” Now you have an idea of what is THE NEAR PERFECT INDICATOR.

Melissa Rivera2022-03-17T19:01:05+00:00March 16th, 2022|Categories: Feature: Stock Market Investing, Featured: News, Financial, Hot Stocks, International, Stock Market, VectorVest 7|Tags: Hot Stocks, Investing, worry-free investing|0 Comments

Share This Story, Choose Your Platform!

FacebookTwitterRedditLinkedInWhatsAppEmail

Related Posts

  • How to Be Imperfect with Money- Fantastic Female Fridays
    How to Be Imperfect with Money- Fantastic Female Fridays
    Gallery

    How to Be Imperfect with Money- Fantastic Female Fridays

    June 22nd, 2022 | 0 Comments
  • VectorVest Issued A Sell for Carvana Before it Collapsed 79% in 7 months!
    VectorVest Issued A Sell for Carvana Before it Collapsed 79% in 7 months!
    Gallery

    VectorVest Issued A Sell for Carvana Before it Collapsed 79% in 7 months!

    June 16th, 2022 | 0 Comments
  • ESG & Tech Show – Fastest Growing ETFs
    ESG & Tech Show – Fastest Growing ETFs
    Gallery

    ESG & Tech Show – Fastest Growing ETFs

    June 16th, 2022 | 0 Comments
  • ESG & TECH SHOW – BLOCKCHAIN – A DISRUPTOR
    ESG & TECH SHOW – BLOCKCHAIN – A DISRUPTOR
    Gallery

    ESG & TECH SHOW – BLOCKCHAIN – A DISRUPTOR

    June 7th, 2022 | 0 Comments
  • How Does A Recession Affect The Stock Market?
    How Does A Recession Affect The Stock Market?
    Gallery

    How Does A Recession Affect The Stock Market?

    May 27th, 2022 | 0 Comments

Leave A Comment Cancel reply

Go Back

Recent Posts

  • How to Be Imperfect with Money- Fantastic Female Fridays
  • How to Protect Profits and Make Money in the Down Market
  • Making Money in a Down Market with Contra Inverse ETFs
  • VectorVest Issued A Sell for Carvana Before it Collapsed 79% in 7 months!
  • ESG & Tech Show – Fastest Growing ETFs

Categories

  • Down Market
  • Earnings Announcements
  • ESG & Tech Show
  • Fantastic Female Fridays
  • Feature: Stock Market Investing
  • Featured: News
  • Featured: Options
  • Financial
  • Hot Stocks
  • International
  • Market in Review
  • Options
  • Press Release
  • Research
  • Retirement
  • Stock Advisory
  • Stock Market
  • Swing Trading
  • Taxes
  • The Views
  • Trade like a Pro
  • Uncategorized
  • VectorVest
  • VectorVest 7
  • VectorVest 7 Release Notes
  • VectorVest News
  • Video Testimonials

Popular Tags

Amazon Amazon.com AMZN Apple bear market Beyond Meat Block formerly Square BSR DocuSign DoorDash Draft Kings earnings earnings announcement ETFs Fantastic Female Fridays Financial planning Hot Stocks how does swing trading work how to learn swing trading Inverse ETFs Investing Market Timing Netflix NPM options Options Trading Palantir Tech Pinterest portfolio management relative safety retirement Robinhood Roku RS RT Special Presentation Susan Hayes-Culleton Swing Trader Swing Trades Swing Trading swing trading for beginners swing trading strategies Twilio Upstart Holdings worry-free investing
  • Products
  • Pricing
  • Contact Us
  • What is VectorVest?
  • Dr. Bart DiLiddo
  • Media Archive
  • Free Stock Analysis
  • Login
Investing 101
Learn to find the right balance between growth and safety.
  • Events & Webcasts
  • Digital Courses
  • Group Coaching
Growth & Income
Grow your net worth no matter what stage of life.
  • Events & Webcasts
  • Digital Courses
  • Group Coaching
Options
Reduce risk and generate income with options.
  • Events & Webcasts
  • Digital Courses
  • Group Coaching
Swing Trading
Exploit short term trades for extraordinary potential!
  • Events & Webcasts
  • Digital Courses
  • Group Coaching
Helpful Resources
  • VectorVest Summit 
  • Investment Calculator
  • VectorVest Reviews
  • Blogs
  • USA
  • Canada
  • Australia
  • UK
  • Belgium
  • Germany
© VECTORVEST INC ®. ALL RIGHTS RESERVED | LEGAL INFORMATION | PRIVACY POLICY | REFUND POLICY | CONTACT US
FacebookTwitterLinkedInYouTubeReddit
Page load link
99¢ Trial Offer: For the Independent Investor!
Got it!
X
Go to Top