Yesterday, AT&T (T) posted 1st quarter earnings that left much to be desired. While subscriber growth was up, revenue was down – and the market reacted by sending shares down more than 10% in Thursday’s trading session.
A key indicator of the telecommunication company’s well-being is postpaid phone plans – a figure representing the number of individuals & businesses paying their bills monthly.
And while AT&T met analyst expectations by adding 424,000 postpaid phone plans in the first quarter, this was a step back from last year. In the first quarter of 2022, the company reported 691,000 postpaid phone plans.
In looking at revenue, the company fell just shy of the Wall Street consensus – reporting $30.14 billion compared to the expected $30.27 billion. AT&T narrowly exceeded the adjusted EPS consensus of 59 cents with 60 cents.
Profitability was down year over year as well, as the company reported a net income of $4.18 billion on that revenue figure – compared to $4.76 billion this time last year. Free cash flow also underwhelmed shareholders and analysts, falling below expectations at just $1 billion in the quarter.
With that said, AT&T executives believe all of this is a sign of a post-pandemic return to normalcy. Subscribers were seeking the most reliable service possible this time last year as the work-from-home movement was in full swing. As companies go back to work and a recession looms large, users are switching back to cheaper services.
Nevertheless, executives with the company still expect to meet its original outlook to generate a free cash flow of $16 billion this year. The first quarter performance may not align with what analysts were looking for, but this is “consistent with our expectations”, executives said.
T has already shot back up almost 4%. in Friday’s trading session a day after earnings were released. This begs the question – is there a reason to buy T at a more favorable price point today than it sat a few days ago? Or, is this lackluster earnings report a sign of what’s to come for the remainder of the year?
We’ve got 3 things you need to see that will help you make your next move with confidence.
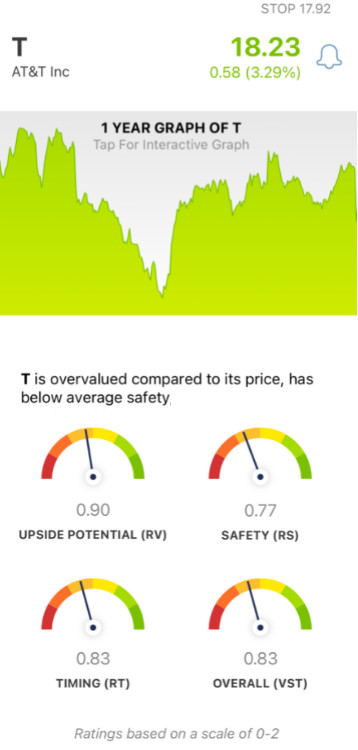
While T Has Fair Upside Potential, the Safety & Timing are Poor For This Stock
The VectorVest stock analyzing software simplifies your trading strategy through an intuitive, proprietary stock-rating system. In just 3 ratings, you’re given all the insights you need to make calculated, confident trades. These are relative value (RV), relative safety (RS), and relative timing (RT).
Each of these sits on a scale of 0.00-2.00, with 1.00 being the average. But based on the overall VST rating for a stock, VectorVest even provides you with a clear buy, sell, or hold recommendation. As for T, here are the current challenges…
- Fair Upside Potential: The RV rating is a comparison of a stock’s 3-year price projection alongside AAA corporate bond rates and risk. And right now, T has a fair RV rating of 0.90 - but this is below the average. Plus, the stock is overvalued at its current price point - with a current value of just 14.34.
- Poor Safety: In terms of risk, T has poor safety - with an RS rating of just 0.77. This is calculated by analyzing the company’s financial consistency & predictability, debt-to-equity ratio, and business longevity.
- Poor Timing: As you can see from yesterday’s steep fall off, T has poor timing to make matters worse - with an RT rating of just 0.83. This is based on the direction, dynamics, and magnitude of the stock’s price movement. It’s calculated day over day, week over week, quarter over quarter, and year over year.
In the end, T has a poor overall VST rating of just 0.83. Does that mean you should cut losses on this stock and move on to the next opportunity? Or, should you hold on a bit longer to see what happens in the near term? Get a clear answer on your next move with a free stock analysis at VectorVest.


Want These Types of Insights at Your Fingertips so You Can Win More Trades?
Use VectorVest to analyze any stock free. VectorVest is the only stock analysis tool and portfolio management system that analyzes, ranks and graphs over 18,000 stocks each day for value, safety, and timing and gives a clear buy, sell or hold rating on every stock, every day.
VectorVest advocates buying safe, undervalued stocks, rising in price. After the company’s underwhelming 1st quarter earnings report, T has fair upside potential - but poor safety and timing holding the stock back.
Before you invest, check VectorVest! Click here to ANALYZE ANY STOCK FREE and see our system in action!


Leave A Comment