The best stock forecasting software is your edge as a trader, whether you’re day trading/swing trading or trying to set yourself up for a lucrative retirement. These tools process data and uncover the patterns you should actually act on.
But with countless options on the market, it’s easy to get overwhelmed. We’ve created a list ranking the top 8 tools available right now, ranging from free screeners to AI-powered platforms that cost thousands. Each has its own approach to helping you find and execute trades.
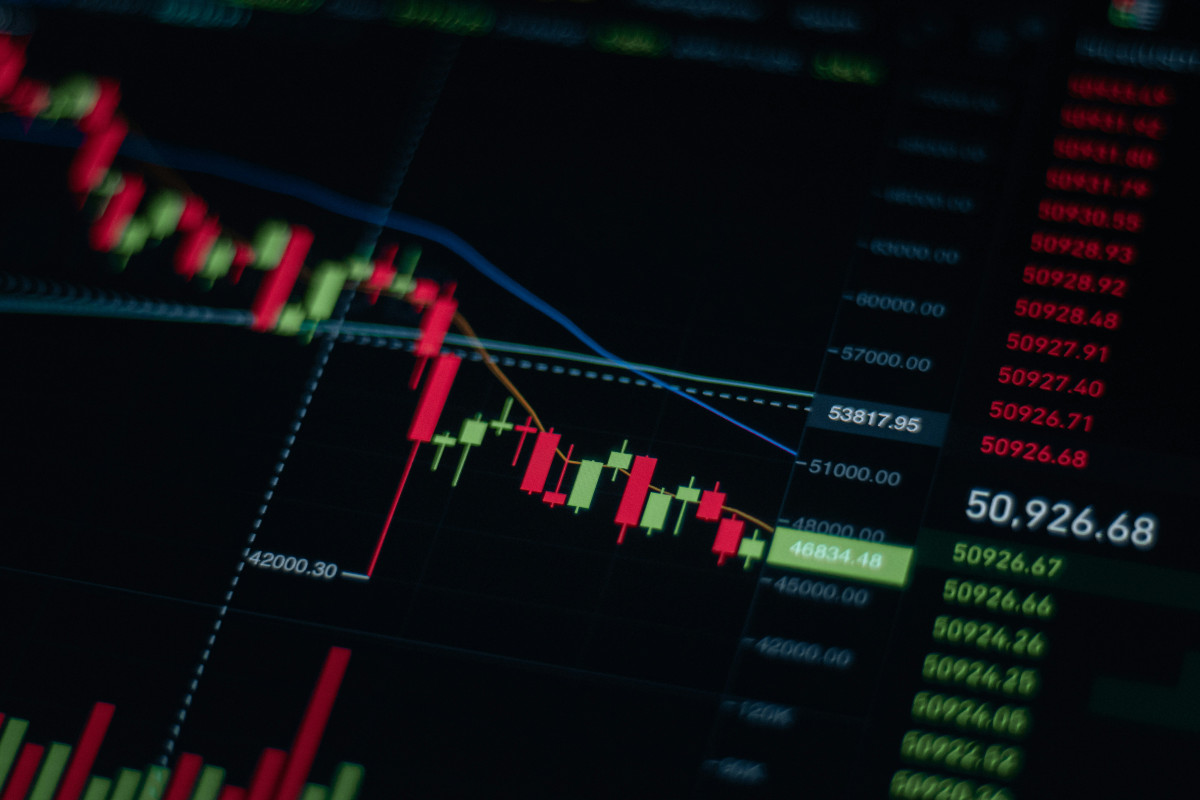
Discover the top stock forecasting software for your goals below!
How Did We Choose These Tools?
We looked at the best stock forecasting software across the full spectrum: free and paid, technical and fundamental, AI-driven and manual. There’s honestly no one-size-fits-all answer to which you should use because your trading strategy and investment goals are unique.
What we can tell you is this – every platform we chose had to demonstrate a real forecasting capability. Some use predictive scoring models. Others rely on proprietary rating systems or automated pattern recognition with backtesting.
We also factored in cost, ease of use, and how much of the workflow each tool actually handles. Some platforms show you data and leave you to figure it out. But there are systems that actually tell you what to do with the opportunities they surface (buy, sell, or hold).
8 Best Stock Forecasting Software 2026
This chart breaks down 8 of the top stock forecasting tools you have at your fingertips right now.
| Tool | Type | Free Plan | Starting Price | AI/Predictive | Markets |
| VectorVest | Rating System | $9.95 trial | $49.99/mo | Yes (VST) | US, CA, AU, EU |
| Finviz | Screener | Yes | $39.50/mo | No | US |
| Stock Rover | Research Platform | Yes | $7.99/mo | No | North America |
| TradingView | Charting Platform | Yes | $14.95/mo | No | Global |
| Danelfin | AI Scoring | Yes | $22/mo | Yes (AI Score) | US + EU |
| TrendSpider | Automated TA | No | $89/mo | Yes (ML) | US |
| WallStreetZen | Fundamental Ratings | Yes | $59/mo | Partial | US |
| VantagePoint AI | AI Forecasting | No | ~$2,900 one-time | Yes (Neural Net) | US + forex |
It just comes down to what type of investment support you’re looking for.
Do you want something that helps you build sophisticated charts so you can identify entries and exits?
Or, would you rather have a system do ALL of the heavy lifting and tell you what to buy, when to buy it, and when to sell it?
There are no right or wrong answers. Let’s go through the top candidates below so you can make the most informed decision on the best stock forecasting software.
1. VectorVest
VectorVest rates over 18,000 stocks every day using a proprietary VST system, which scores each stock on three dimensions:
- Relative Value (RV) – what the stock is worth based on forecasted earnings
- Relative Safety (RS) – how predictable the company’s financial performance is
- Relative Timing (RT) – whether the price trend is moving in the right direction
Those three scores are all placed on a simple scale of 0.00-2.00, with 1.00 being the average. Every stock also gets a clear buy, sell, or hold recommendation. No interpretation required. You can dig deeper with technical and fundamental analysis within the VectorVest platform, or you can just trust its guidance to win more trades with less work. VectorVest has outperformed the S&P 500 index by 10x over the past 22 years and counting.
VectorVest also includes market timing indicators that track overall market direction, so you know whether it’s the right time to trade or you should sit on the sidelines and wait for better conditions. The Confirmed Calls system flagged the 2000 dot-com crash and the 2008 financial crisis before the worst damage hit. It also called the 2020 COVID sell-off early enough for subscribers to get defensive.
You can run the platform on desktop (VectorVest 7) and web (Market Launchpad). Or, use the mobile Stock Advisory app to trade no matter where you are. Plans start at $49.99 per month with a $9.95 trial for 30 days.
Pros
- Clear buy, sell, or hold recommendation on every stock, every day
- Market timing system that signals when to buy and when to protect capital
- 22-year auditable track record of outperformance
- Covers US, Canadian, Australian, and European markets
- Multiple tiers from beginners ($49.99/mo) through advanced traders ($149/mo)
- Integrates with brokerages to streamline trade execution
Cons
- Desktop software (VectorVest 7) is Windows-focused
- Real-time data requires the Premium tier at $149 per month
- Learning all the proprietary indicators takes time upfront
Best For
Investors who want a system that tells them what to buy, when to buy, and when to sell, backed by a 30-year-old rating methodology with a verifiable track record. Best rate of success with the least amount of work on your end.
2. Finviz
Finviz is one of the first screeners investors come across, and the free version is legitimately useful. You get 67 filter criteria spanning fundamentals and technicals across 8,500+ US stocks and ETFs. The signature heatmap shows you the entire market’s performance at a glance, color-coded by sector and market cap.
Finviz Elite costs $39.50 per month (or $299.50 per year) and unlocks real-time quotes and premarket data. You also gain access to advanced charting with backtesting.
We see the FinViz Elite vs Trade Ideas question come up all the time. It really depends on whether you need a visual screener or an algorithmic scanner with real-time alerts. Again, no right or wrong answers.
Pros
- One of the best free stock screeners available
- Heatmaps offer unparalleled market visualization at a moment’s notice
- 67 screening criteria across descriptive, fundamental, and technical filters
- News aggregation from major financial outlets
Cons
- Free tier runs on 15-minute delayed data
- US markets only
- No predictive AI or stock scoring system
- Charting tools are functional but not advanced
Best For
- Traders who need a fast, visual way to filter stocks and monitor sector performance without paying for a subscription
3. Stock Rover
Stock Rover is the deepest fundamental research tool on this list without question. The platform offers 800+ financial metrics and intrinsic value calculations. It also has portfolio analytics and research reports with buy/sell ratings.
Premium Plus adds Monte Carlo simulations and 10-year financial history for $27.99 per month. Barron’s named it an Editor’s Choice for a reason. It definitely belongs in the contention for the best stock forecasting software on the market.
The catch? For all its depth on the fundamental side of things, it feels a bit thin on the technical analysis front. That matters for active traders who are looking for precise entry/exit.
Pros
- Deepest fundamental analysis at this price point (starting at $7.99/mo)
- Portfolio rebalancing and performance attribution tools
- Research reports with fair value estimates
- Free plan available with basic screening
Cons
- North American markets only
- Essentially no technical charting functionality
- Interface overwhelms new users with data density
- No real-time streaming data
Best For
- Buy-and-hold investors and value seekers who want deep financial data before committing capital. Not those who need to make decisions based on technical data.
4. TradingView
TradingView is the world’s largest charting platform with over 100 million users. The charting engine supports 400+ technical indicators and multi-timeframe analysis. Pine Script lets you build custom indicators and strategies from scratch.
There’s also a really cool social feed where traders publish ideas and share scripts with one another. That’s helpful considering how complex and confusing the charting system is for beginner investors.
TradingView covers every major asset class in the world, from stocks and ETFs to forex and crypto, across dozens of exchanges. Paid plans start at $14.95 per month, while premium runs $69.95 per month.
We’ve got some really great comparisons of TradingView vs TrendSpider and Trade Ideas vs TradingView if you want to see how other charting tools lineup side-by-side. We’ll cover some of these other solutions in our guide below.
Pros
- Best charting tools available at any price
- 100M+ user community sharing trade ideas and custom scripts
- Pine Script lets you build nearly anything
- Global coverage across all major asset classes
Cons
- Free tier limited to one chart and two indicators
- No AI-powered forecasting or stock scoring
- Higher tiers escalate quickly ($69.95+/mo for Premium)
- Fundamental data is surface-level compared to dedicated research platforms
Best For
- Technical traders who want the most powerful charting platform available and want to lean on a massive community for idea generation. You need to have quite a bit of experience in charting to begin with, though, or you won’t be able to capitalize on it.
5. Danelfin
Danelfin assigns every stock and ETF a daily AI Score from 1 to 10 based on 10,000 features per ticker. The system draws from 600+ technical indicators, 150+ fundamental metrics, and 150+ sentiment signals – so it’s a bit more balanced but definitely a better fit for active traders.
Each stock gets subscores for fundamentals and technicals. Sentiment and downside risk are scored separately. The model’s track record stretches to 2017. Stocks rated 10 out of 10 outperformed the S&P 500 by over 21% annualized alpha in backtesting, and the AI Score Audit feature lets you see exactly why any stock got its rating.
Plans start at $22 per month, and Danelfin covers both US and European stocks (5,500+ tickers across Europe alone) along with over 3,700 ETFs. Definitely a great option if you’re on a tighter budget and can’t pay double the price for VectorVest. You get what you pay for, though!
Pros
- Analyzes 10,000 features per stock daily
- Transparent scoring: AI Score Audit shows the reasoning behind every rating
- Backtested track record since 2017
- Covers US and European stocks plus ETFs
- Free plan includes daily top 10 picks
Cons
- No charting tools built into the platform
- No broker integration for direct trading
- Elite tier runs $134/mo for API access and historical data
- Scores are probabilistic, not directional buy/sell signals
Best For
- Quantitative investors who want AI to handle stock selection with a transparent, auditable scoring methodology, all at a reasonable price.
6. TrendSpider
We mentioned TrendSpider earlier, and it’s also one of the best stock forecasting software options you can leverage. It automates what technical analysts do by hand.
The platform draws trendlines and automatically detects chart patterns. It identifies support and resistance zones and backtests strategies without you writing a single line of code, so it’s a better fit if you like the idea of TradingView but find the interface and functionality to be a little overwhelming.
The indicator library covers 400+ options. AI Strategy Lab lets you train custom machine learning models on your own criteria if you’ve perfected your trading strategy and simply want to scale it.
Real-time US options data via OPRA was added in March 2026, essentially leveling the playing field for retail traders. Starts at $89 per month, or $59 per month annually. There is no free tier.
Pros
- Automated trendline and pattern recognition replaces hours of manual charting
- No-code backtester with 50+ years of historical data
- AI Strategy Lab for training custom ML models
- Real-time options data added in 2026
Cons
- Most expensive entry point on this list at $89/mo (monthly billing)
- No free plan available
- US markets only for individual stocks
- Standard tier limits backtesting granularity and workspace count
Best For
- Active technical traders who want software to automate chart analysis and pattern detection instead of doing it manually
7. WallStreetZen
WallStreetZen is perhaps the simplest option on this list. It assigns every stock a Zen Rating based on 115 fundamental factors, condensed into a letter grade from A to F. It tracks 3,000+ Wall Street analysts with full historical accuracy data and automates DCF analysis. Every stock gets 38 due diligence checks.
Premium costs $19.50 per month on annual billing ($59 monthly). Coverage includes about 4,600 US stocks.
Pros
- Simplest rating system on this list: one letter grade per stock
- Tracks 3,000+ analysts with win-rate data
- Affordable at $19.50/mo on annual billing
- Free plan available for basic research
Cons
- US stocks only with a smaller universe (4,600+) than competitors
- No technical charting or pattern recognition
- No options, forex, futures, or crypto coverage
- Stock purchases redirect through eToro
Best For
- Part-time investors who want a straightforward letter-grade rating without getting into technical analysis. Super straightforward for newcomers.
8. VantagePoint AI
Finally, we have VantagePoint – a patented neural network technology and intermarket analysis tool that claims to forecast price direction up to 3 days in advance. The system analyzes correlations between up to 30 related global markets per instrument. Whether it’s something you can trust to perform day in, day out is up in the air – but it certainly sounds great in theory.
That said, the company has been around for nearly 40 years. It’s the longest-running AI trading software on the market. Pricing starts at roughly $2,900 for a single-sector license, requires a sales call, and there is no trial. It’s definitely a little different from anything else on this list, but that’s the point – there’s something for everyone!
Pros
- Patented intermarket analysis considers how correlated global markets influence each other
- Predicted Moving Averages are forward-looking, not lagging indicators
- 45+ years of development behind the technology
- Covers US stocks, forex, ETFs, and crypto
Cons
- By far the most expensive tool on this list at ~$2,900+ one-time
- No free trial and no free plan
- 87.4% accuracy claim is self-reported with no independent verification
- Pricing is not listed publicly and requires a sales consultation
Best For
- Experienced traders with tons of capital who are willing to invest in AI-driven directional forecasts without testing first
What is a Stock Forecasting Software?
Each of these tools was handpicked for a very specific reason. But let’s take a step back – what’s even the point of stock forecasting tools, and how do they work?
This type of software uses algorithms and statistical models to analyze market data and clue you into where prices might head next. They do exactly what they sound like – help you make smarter, more calculated trading decisions.
They don’t all work the same way, though. Some tools lean on technical indicators like moving averages and volume patterns. A lot of them rely on fundamental data like earnings growth and valuation ratios. All the hype these days is surrounding tools that leverage machine learning trained on thousands of features to produce a probability score or a directional prediction.
The common theme is these tools eliminate (or at least reduce) guesswork. You get a data-backed signal instead of making trades based on a headline or a tip.
Now, the quality of that signal varies dramatically from platform to platform. That’s why you need to do your due diligence and figure out which actually aligns with how you trade.
Who Can Benefit From a Stock Forecasting Tool?
The short answer is anyone who buys and sells stocks should make life easier for themself and increase their rate of success with a stock trading tool. The only difference is in which tool aligns with your goals. The best stock forecasting software looks different for a retiree than it does for a day trader, so knowing your own style matters before you pick a platform.
- Beginners who want guardrails: A rating system that says “buy” or “sell” takes away the analysis paralysis of having too many options and not enough experience to sort through them. It helps you hit the ground running right away.
- Active traders running multiple positions: Screeners and automated pattern detection cut research time from hours to minutes, so you’re not glued to your screen from market open to close.
- Long-term investors building a retirement portfolio: Fundamental analysis and fair value tools help you avoid overpaying or holding underperformers too long.
- Swing traders hunting short-term setups: Backtesting and timing indicators let you confirm a setup before you risk real money on it.
Some tools are sophisticated enough that they can serve all these investors at the same time, like VectorVest. Others are more one-dimensional, like TrendSpider or TradingView.
What to Look For in a Stock Forecasting Software
We know you might not feel certain of which of these 8 tools best suits your goals and strategy. Here’s how you can narrow it down:
- Actionable output: Does the platform give you a clear signal, or does it dump raw data and expect you to figure it out on your own?
- Track record: Any tool can run a backtest – but very few actually let you see how they’ve performed over the years.
- Market coverage: Obviously, the tool needs to cover the types of assets you actually trade, be it international stocks, options, or crypto.
- Cost to value: A $2,900 license isn’t expensive if it generates consistent returns. A $20 subscription is overpriced if it doesn’t improve your decisions. You get what you pay for in most cases, but look into value for the money over price alone.
- Ease of use: The most powerful tool is worthless if you never learn to use it. Match the complexity to your experience level. Some of these tools require you to basically be an expert coder with a strong grasp of technical analysis.
What to Avoid With Stock Forecasting Software
Accuracy claims that you can’t verify are the biggest red flag. Any tool can say it predicts the market with 87% accuracy. But are they willing to show you proof? The answer is no more often than not. VectorVest, for example, is one of the only systems that lets you view historical recommendations.
Any platform that won’t explain how its scores are generated isn’t letting you evaluate whether the methodology makes sense for your style of trading. That’s another dealbreaker. Transparency is everything.
But how you actually use these tools matters, too. They are there to sharpen your decisions, not replace your judgment. You’ve gone too far if you can’t explain why you’re in a trade without pointing at the software.
Our Criteria in Selecting These Software
We take our recommendations seriously, and handpicked all 8 of these solutions after putting them through the wringer. Here’s the lens we viewed them through:
- Forecasting methodology: What data does it analyze, and how does it turn that into something usable? We gave priority to tools that produce clear, actionable output over tools that display raw data.
- Verification: Does the platform have an auditable track record spanning years and market cycles?
- Accessibility: Pricing, free plans, trial availability, and ease of onboarding all factored in. An expensive tool with no trial is hard to commit to.
- Coverage: How many markets and asset classes does the tool support? Platforms with global and multi-asset coverage earned extra credit.
- User experience: Can a new user extract value in the first session, or does it require weeks of learning? The best stock forecasting software should not need a manual to produce results.
In weighing every single one of these variables, one tool stands head-and-shoulders above the rest: VectorVest. It’s been calling every major market move for decades, empowering investors to win more trades with less work and stress. Give it a shot today.
Frequently Asked Questions
Who is the most accurate stock forecaster?
VectorVest’s VST system has outperformed the S&P 500 by 10x over the past 20 years. It’s also called major market moves in advance, so its users could move to cash before downturns and capitalize right before upswings. It’s one of the only systems that lets you see historical performance, too.
Is there a way to see how my strategy would have performed historically?
Yes, this is called backtesting, and most of the tools we’ve listed in this guide offer it – it’s just a matter of what tier the feature is gated behind.
Which stock forecasting tool lets me build rule-based forecast signals with backtesting built in?
TrendSpider’s no-code strategy builder lets you define conditions, test them against decades of historical data, and automate alerts when those conditions trigger. TradingView offers even more flexibility through Pine Script if you’re comfortable writing code.
Should I use forecasting tools that rely on technical indicators or a model-based time series?
Why choose when you can have the best of both worlds? VectorVest’s Timing score tracks price dynamics while the Value and Safety scores cover the fundamental side of things.
Do any of these tools work best for building a watchlist?
The VectorVest stock advisory app lets you build watchlists sorted by the VST composite so the highest-rated stocks always sit at the top. Most tools support watchlist building in some manner.
Which tools help you find stocks, validate trades, and execute them from A to Z?
VectorVest handles everything from stock selection and timing through to broker-integrated execution. It supports swing traders, options traders, retirement planning, and everything in between. Run any ticker through the system with a free stock analysis and see what a complete recommendation looks like.
Related Resources
Tipranks vs Seeking Alpha | Tipranks vs Motley Fool | Stock Rover vs Seeking Alpha

Leave A Comment