by Leslie N. Masonson, MBA
Cathie Wood, CIO and portfolio manager of ARK Investment Management is well-known and outspoken about her firm’s “disruptive innovation” ETFs. She has been their cheerleader during the 2020 through 2023 tumultuous period. This market segment encompasses companies involved in the following businesses: neural networks, cryptocurrencies, digital wallets, reusable rockets, programmable biology and autonomous vehicles, among others.
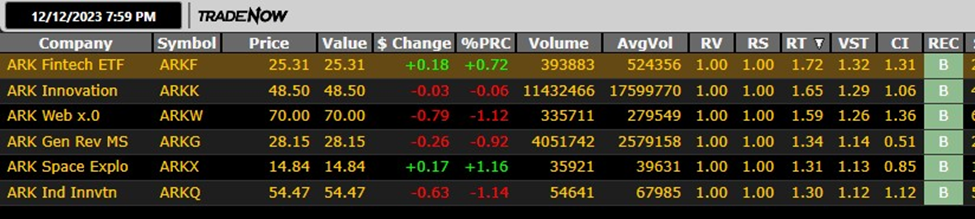
VectorVest subscribers can use the ETF Viewer to obtain the current “Buy, Sell or Hold,” recommendation of the ARK ETFs (see below). This Viewer is located on the 4th tab on top of Home page labelled Viewers. By clicking on it, you can insert the ticker symbols of these ETFs. That produces the results below (I did not include ARK’s two other ETFs — IZRL and PRNT), as I wanted to just focus on the six ARK brand names:
.
Here you can see that ARKF, ARKK and ARKW have very high Relative Timing (RT) scores of 1.59 or greater (on a scale of 0 to 2.00), and all have “Buy” ratings. Moreover, ARKF, ARKK, ARKW and ARKQ have a Comfort Index of greater than 1.0. The higher the CI number the more stable the stock has been over the years. This is a number that conservative investors should view to see if it falls within their risk parameters.
As opposed to stocks, notice that the RV and RS values are automatically assigned a 1.00 which means that the VST is based on the RT. Since ETFs are composed of a portfolio of stocks their VectorVest rankings for RS and RV are indeterminable. The same logic applies to an ETF’s fundamental measurements including sales, earnings growth rate, earnings and growth to P/E ratio where their scores are set at zero.
ARK ETF PERFORMANCE
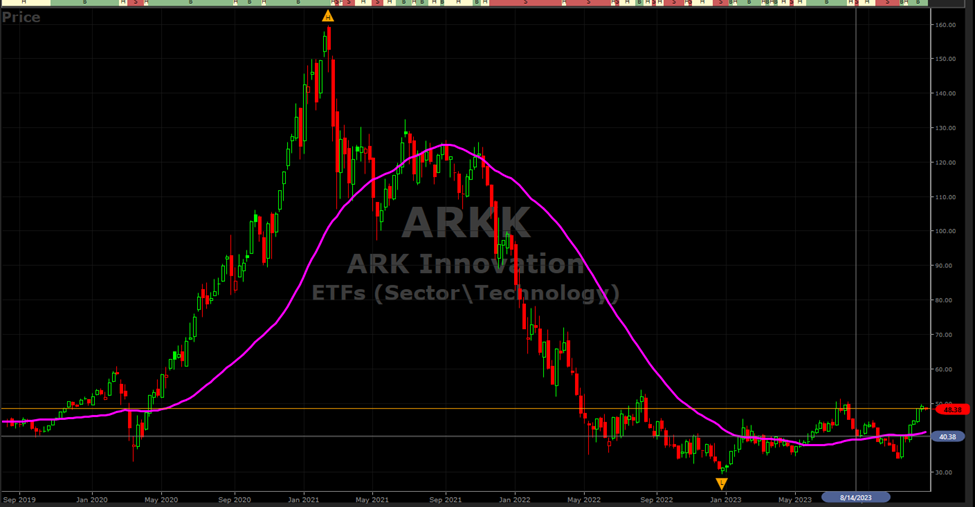
ARK ETFs have been in the news over the past four years based on their awe-inspiring performance during the March 2020 through February 2021 period when they skyrocketed 150- 250% each, as well as their disastrous performance from mid-February 2021 through December 27, 2022 when they each cratered 65% to 75% or more.
Below is a chart of ARKK which is representative of the overall ARK ETF performance during that period. This illustrates that a buy-and-holder investor in early 2020, did not do well holding until today. That is why market timing and VectorVest’s Daily Color Guard are critical market metrics to understand and follow, so that you do not end up on the wrong side of the market, after watching in soar, and thus giving up all your profits.
.
So far in 2023, the ARK ETFs have come back to life in a big way (see table below), but they are still down about 70% from their all-time highs. This resulted in a large outflow of billions of dollars of assets over this latter period.
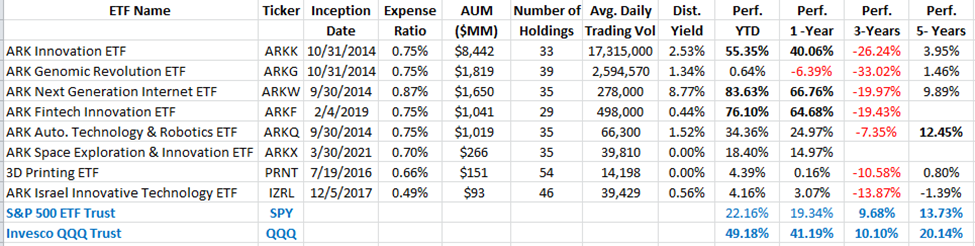
Let’s take another look at more data on these ETFs from ETFAction.com. Here we see that ARKK is the mother lode with $8.4 billion AUM, followed by ARKG at $2.6 billion, and ARKW at $1.65 billion. All these concentrated portfolios are similar in size with 29 to 54 stocks. Four of these ETFs came to market in the Fall of 2014, while the last to market was ARKX in March 2021.
The year-to-date and one-year performance are outstanding, while the performance of the S&P 500 ETF and Nasdaq 100 (QQQ) is provided. Clearly, over three and five years the benchmarks have outperformed these ETFs with much less volatility and heartache.
.
As far as trading volume, ARKK leads the pack with ARKG in second place, with 17.3 million shares, and 2.6 million, respectively. ARKW and ARKF have adequate volume of 78,000 and 498,000, respectively, while ARKQ and ARKX volumes are magnitudes lower.
How will these ETFs perform going forward is anyone’s guess, but if their component companies can produce positive and growing earnings, then they can prosper. The top combined holdings of these ETFs in order are: TSLA, COIN, ZM, ROKU and PATH. The Coinbase Global (COIN) performance this year advancing from $30 in January to $150 has had a major positive impact on the ARK ETF performance. This is a terrific 400% return. COIN represents about 10% or ARKK’s portfolio, and there are 8 million shares held among the ARK ETFs.
Moreover, other portfolio components have also had big 2023 returns of at least 100% including, ROKU, Uipath and Tesla.
Anyone interested in any of these ETFs is first urged to go to the website at www.ark-invest.com to obtain the ticker symbols on the top 10 holdings and place them in the Stock Viewer to see their VectorVest ratings. Look for a high number of “Buy” ratings before considering a purchase in an ARK ETF, and of course, graph the ETF with RT, MACD, 40-dma and any indicators of your choice.
If you are not yet a VectorVest client, I suggest you take advantage of a trial subscription so you can see for yourself the value that the software provides. The ETF Viewer tracks almost 1,900 ETFs popular and actively traded ones while the remaining available 1,400 ETFs are not followed due to various factors including their short lifespans, low assets under management, or low trading volume or a combination of these factors.


Want These Types of Insights at Your Fingertips so You Can Win More Trades?
Use VectorVest to Analyze any stock free. VectorVest is the only stock analysis tool and portfolio management system that analyzes, ranks and graphs over 18,000 stocks each day for value, safety, and timing and gives a clear buy, sell or hold rating on every stock, every day.
Before you invest, check VectorVest! Click here to ANALYZE ANY STOCK FREE and see our system in action!


Leave A Comment