by Leslie N. Masonson, MBA
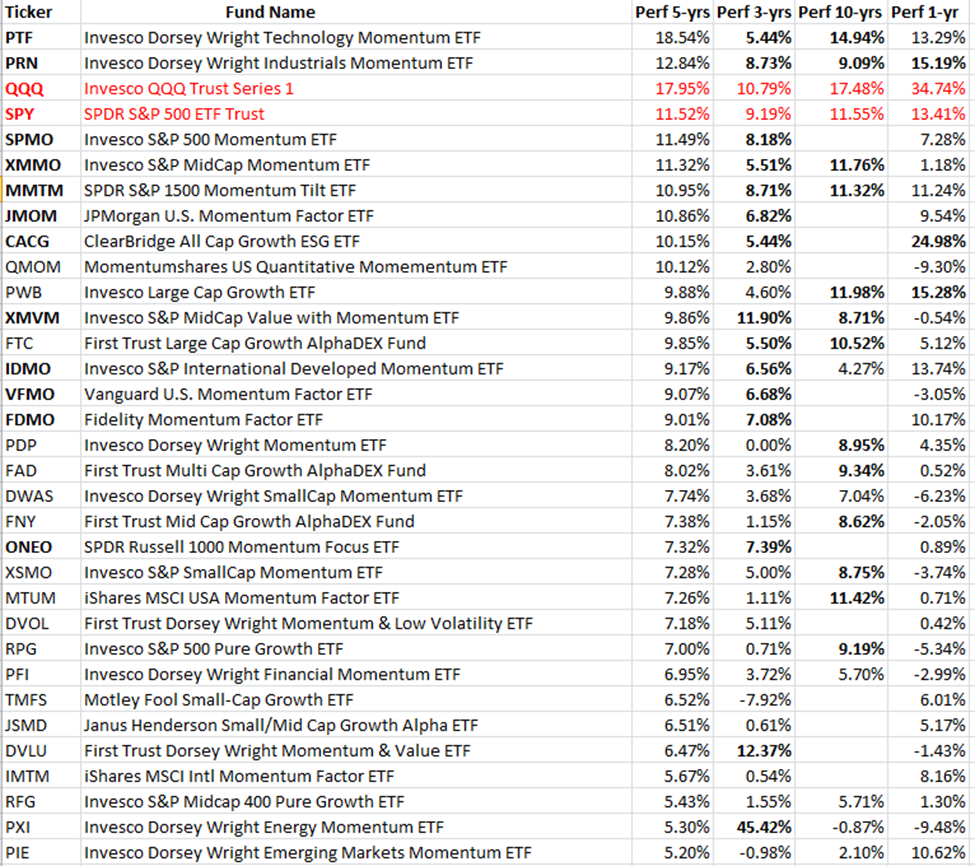
The previous article provided an introduction to momentum investing. The key question on investors’ minds is how well have momentum ETFs performed since their inception, compared to common benchmarks. Initially, a handful of these ETF came to market in 2005-2006, and then many more joined the category. I used ETFAction.com to obtain data on this category as shown the table with the data over four time periods through November 10, 2023.
There are 76 ETs in their momentum/growth category with a total of $34.0 billion in Assets Under Management (AUM) with an average expense ratio of 0.53%. Year-to-date the net inflows have totaled $1.6 billion. Note the data is arrayed by five-year performance in the left column as follows:
.
The bolded names enjoyed the best performance in the multiple time periods. Clearly, Invesco holds the top four spots –PTF, PRN, SPMD, and XMMO in the five- year performance ranking, but interestingly both of the well-known benchmarks shown came out very high in the rankings, beating almost all ETFs in the list over multiple time periods.
The SPDR S&P 500 ETF Trust came in 4th place with a showing of 11.52%, while the wildly popular Invesco QQQ Trust Series 1 (Nasdaq 100) came in 2nd place with a 17.95%. Moreover, QQQ had a higher ten-year percentage than all the ETFs existing at the time, and another market-beating one year performance with a first place finish with 34.74%. The 2nd place finisher in the one-year timeframe was STLG (iShares Factors US Growth Style ETF) at 34.25% which was so new that it is not listed on the portion of the chart shown above. And, only 19 ETFs out of the 76 beat the S&P Index for the past year, which is disappointing.
After looking over the entire database of these ETFs, here is a summary of my findings:
- Total assets of each varies from $8 billion to $5 million.
- Net expense ratios range from a low of 0.12% to a high of 1.13%.
- Annual dividend yields range between 0.22% and 7.14%.
- Number of portfolio holdings range between 21 to 1,463 (MMTM), with most between 50 and 150
- Stocks in these portfolios are specific to the individual ETF’s selected universe. They could be small-, mid- or large-caps, global, emerging markets, and hedge funds.
- Ten-year returns are available for only 30 of these ETFs.
- Five-year returns are available for 46 ETFs.
- Average daily trading volumes of over 100,000 shares a day encompasses only ten ETFs. The largest average trading volume ETFs are CGGR, DUHP, CGXU, CGGO, and MYUM.
- At present, there are no leveraged or inverse ETFs focusing solely on momentum.
Investors and traders should probably not use a buy-and-hold approach or use leverage (buying on margin) when using momentum ETFs because a sharp market reversal can be devastating, if the portfolio is not closely monitored and stop loss orders or other defensive measures are not put in place, as soon as a position is established.
Before investing in any momentum-based ETF, be sure to read the information available from the sponsor’s website, and other internet sources such as etf.com. Be sure to check out the fund’s objective, top 10 holdings, methodology for selecting the portfolio components, risk factor and the portfolio turnover. With such a wide dispersion of variables to evaluate, these ETFs are hard to compare to each other and many use non-comparable benchmarks.
So, be careful if you decide to invest in these ETFs and only place a small percentage of your assets in these funds, such as 1 to 5%. These ETF don’t appear to be good trading vehicles compared to the many other ETFs available with much higher daily trading volumes, much lower bid-to-ask spreads, and higher volatility. Twenty one ETFs in the momentum category came public in 2021 and 2022 with none so far in 2023. The category is already oversaturated and the weak players with assets below $50 million or daily volume below 50,000 will probably disappear within a few years. That is why I will focus on a few of the top performers in Part 3 next week.


Want These Types of Insights at Your Fingertips so You Can Win More Trades?
Use VectorVest to Analyze any stock free. VectorVest is the only stock analysis tool and portfolio management system that analyzes, ranks and graphs over 18,000 stocks each day for value, safety, and timing and gives a clear buy, sell or hold rating on every stock, every day.
Before you invest, check VectorVest! Click here to ANALYZE ANY STOCK FREE and see our system in action!


Leave A Comment