
by Leslie N. Masonson, MBA
Last week’s Part 1 September 30 article provided background on Fidelity’s select sector mutual fund since its 1981 inception, as well as State Street Global Advisors’ (SSgA) ETF sector funds introduction in 1998. The listing of Fidelity and SSgA sectors with their tickers were provided. This article will cover sector performance and a handful of tips on evaluating ETFs for purchase.
SSgA’s Annual Sector ETF Performance Varies Widely
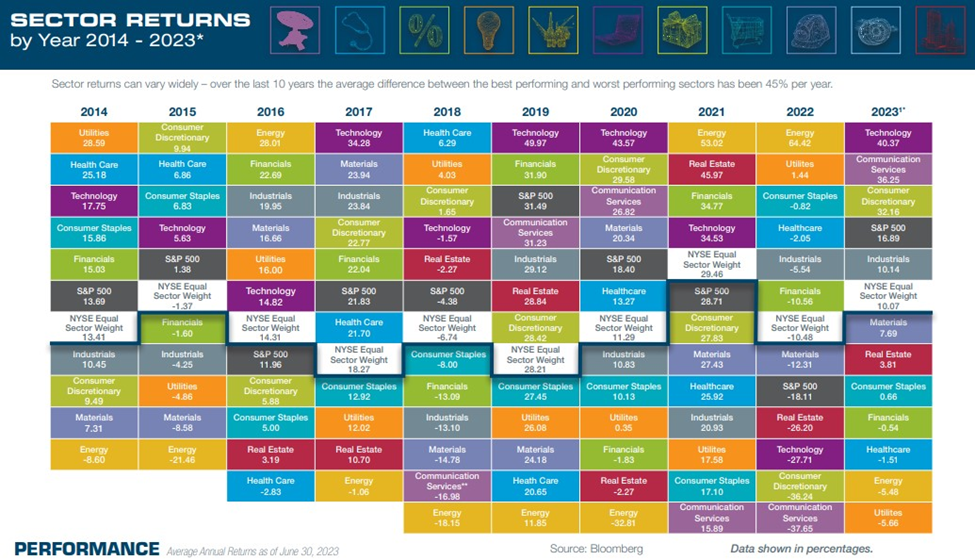
As expected, the performance of the S&P sectors varies widely on a week-to-week, month-to-month and especially year-to-year basis. The table below depicts SSgA’s Select SPDR yearly performance from 2014 through June 2023. Each ETF was assigned a different color. As you can see the top and bottom performers keep changing each year.
Note the weakest performance of energy for 2014 through 2020, except for a top performance in 2016, followed by a wipeout in 2020, but with top rankings again in 2021, and 2022, and so far in 2023 (chart ends in June not showing performance to September 22). Unfortunately, it is almost impossible to predict one year in advance which sectors will be the top ranked, as the result of the table appears almost random, except the repeaters in certain consecutive years.
The annual returns of the Select SPDR ETFs indicates the range in performance in a single year varies as much as 101 percentage points.
This rare performance gap occurred in 2022 comparing the Energy ETF with a gain of 64.4% to Communications Services which lost 37.7%. Most years the spread is smaller, but at least 30 percentage points from top to bottom performance.
The equal sector on the table is represented by the NYSE Equal Sector Weight (white box) which typically appears near the middle of the pack, certainly better than the bottom five sectors in most recent cases since 2018. The S&P 500 (deep grey color box) itself, a market-capitalization weighted index, had better performance than the equal weight comparison in 7 of the last 10 years. Again, no one knows in advance which sectors will outperform going forward.
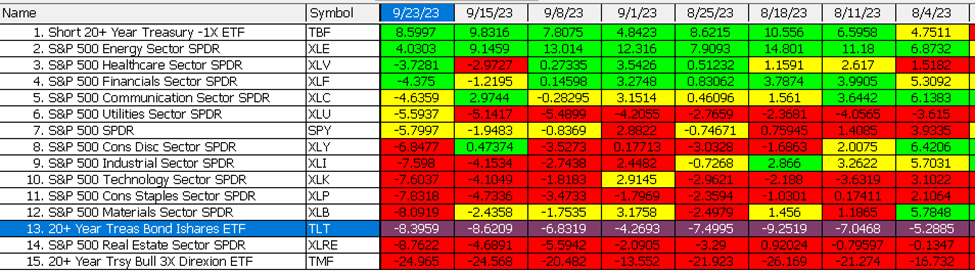
Relative Strength Sector Comparison
On a more granular basis, the data table below ranks the relative strength (percentage change from the best (green) to worst performers (red) in the Select SPDRs), as well as to S&P 500 (SPY) and two bond ETFs (TLT and TBF for my personal use) each week ending on a Friday market close. The number in the box is the percentage change in price for each ETF for the prior 8 weeks. For example, XLE is up 4.03% since the 8/4 close, while XLRE is down 8.76% in the week ending September 23. The data for September 15 shows the performance for the eight weeks prior to that date.
.
The number of weeks selected for review is user-defined to determine if any patterns exist. For example, the weekly change can be shown, and a long horizontal of green colored boxes over multiple time periods would indicate the best performers. Clearly, TBF and XLE have had the best performance over the past eight weeks with the highest overall consistent rankings.
Selecting Sector ETFs for Purchase
There are a host of questions to answer when attempting to find a profitable sector rotation strategy such as: Which sector ETF(s) should be purchased, and when? How many ETFs should be bought? What is the best way to determine when to enter or exit (if it is in your portfolio) a sector ETF? How long should they be held for? These questions require extensive answers which can’t adequately be covered in this limited blog format. However, I did want to provide a few ways to select sector ETFs and how to evaluate them.
Common Sector ETF Evaluation Techniques
On a candlestick chart of each ETF, use common technical analysis tools of your choice such as the 8- or 10-day moving average for traders and the 40- or 50-day for investors, MACD, support and resistance and trend lines, and Relative Strength Index (RSI). Depending on your timeframe, either use daily or weekly charts, as the latter will eliminate the daily noise in the markets.
Additionally, consider placing the 10 SSgA sector tickers in a VectorVest Watchlist. Then, run the search daily to look for the top-rated ETFs that have the highest RT score accompanied by a “Buy” recommendation, if any. You can then purchase the top 1 to 3 ETFs, only if on a “buy” signal and when the “Primary Wave” is also on a “Buy” signal, if you are a short-term trader, or a “DEW” or “Greenlight/Buyer” signal for an intermediate trader or the Confirmed Call for a long-term trader.
Use the weekly MACD as a confirming indicator for intermediate and long-term traders, or the daily MACD for short-term traders. Also, note when the Buy-to-Sell ratio (BSR) reaches oversold levels of below 0.20 (as it is now) and then rises above that level, as well as if the MTI declines below 0.60 (as it has now) or more, and then rises above 0.60, Those reading are typically seen at market bottoms, and Bottom Fishing strategies found in the UniSearch tool can identify winners which can run up 25 to 40% in a week, if there is an explosive rally off the bottom.
But don’t guess or jump in prematurely that the bottom is in without proof of a reversal. Wait for the Daily Color guard bullish signal. Run multiple aback-tests using the software to see which the best timers are and what stop criteria provides the best combination of returns. The financial rewards can be substantial, but always make sure to have stop orders in place to protect your principal.


Want These Types of Insights at Your Fingertips so You Can Win More Trades?
Use VectorVest to Analyze any stock free. VectorVest is the only stock analysis tool and portfolio management system that analyzes, ranks and graphs over 18,000 stocks each day for value, safety, and timing and gives a clear buy, sell or hold rating on every stock, every day.
Before you invest, check VectorVest! Click here to ANALYZE ANY STOCK FREE and see our system in action!


Leave A Comment