by Leslie N. Masonson, MBA
Last week’s article focused on the basics of thematic ETF investing with a data table of the earliest providers of that ETF category. The two questions to be answered in this article are: Are any of these 246 ETFs worthwhile to invest in? If so, what allocation should be considered in your overall portfolio mix?
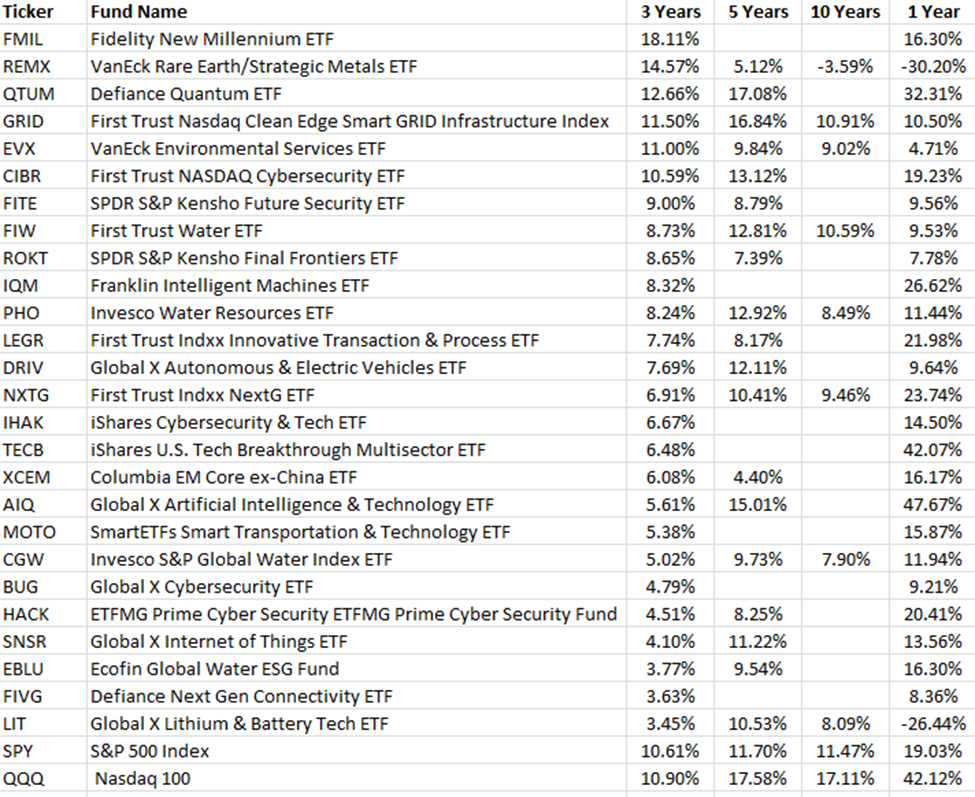
Let’s review the performance of the top ranked thematic ETFs over multiple timeframes with the table ranked on 3-year returns, as provided by ETFAction.com, as of the close on November 4, 2023:
Top Three-Year Performers
.
Viewing the three year data above in the first column, clearly indicates that only five ETFs beat the performance of the S&P 500 and Nasdaq 100 (listed as the last two table entries) for comparative purposes. Digging into all the data (not shown here), I found that only 127 ETFs had a 3-year performance record and 90 of these ETFs actually had losses for this period. This is not very encouraging for potential investors, as these ETFs are highly concentrated with much higher risk than the two benchmarks.
Only 60 ETFs had positive five-year performance, while another 20 actually lost money while the S&P and Nasdaq had double digit returns. As the table shows, seven of the ETFs did not have 5-year returns, but the ones that did had positive returns. Interestingly, none of those ETFs beat the two benchmarks over 5 years. Again, not a very encouraging record for potential investors in this category.
Going out 10 years, there were only 22 ETFs in that elite category with all but one showing positive returns. The sole loser was REMX (VanEck Rare Earth/Strategic Metals) which by the way was the 2nd top performer over three years as seen above.
The top three performers over ten years were SKYY (First Trust Cloud Computing ETF) with 12.2% annual return, GRID (First Trust Nasdaq Clean Edge Smart GRID Infrastructure ETF) with 10.9%, and FIW (First Trust Water ETF) with 10.5%. Not surprisingly, none of these ETFs beat the two benchmarks, with the S&P 500 gaining an 11.47% average annual return, and the Nasdaq returning 17.11%.
ONE YEAR PERFORMANCE
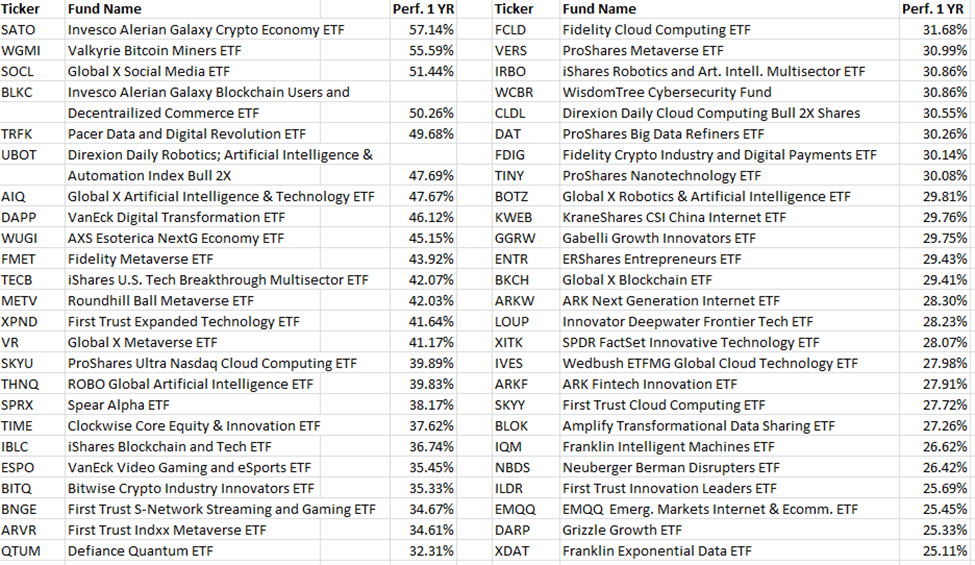
The table below sorts the top 50 ETFs solely on the much shorter one-year timeframe through November 4, 2023. Here, I did not include the other performance columns because the results were sparse and meaningless. Moreover, there were no excellent performers for those periods in the top one year winners. Clearly, in any one year, like 2023 there will always be one or more themes that outperform.
This past year the best thematic performers were cryptocurrency, bitcoin, robotics, disruptive innovation (e.g., ARKW, ARKF), Metaverse, Artificial Intelligence, digital transformation, and cyber security. Clearly, there were many big winners this past year and those listed on the table had a 25% or better showing. Next year the list will most likely change, as other themes will emerge as the winners, and most likely some of the above ETFs may continue to shine.
Top One Year Performers
.
Generally speaking, thematic ETFs offer investors and traders the ability to add some unique exposures to future technologies in their portfolios. If an individual wants to add a 5 to 10% total position, then consider a 1% to 2% position in any five of six diverse ETFs such as GRID, FIW, AIQ, UBOT, ESPO and FCLD, or any others of your choice.
Remember to check the sponsor’s website, place the ETF on a 1 and 3 year chart with your favorite indicators, and check the VectorVest Daily Color Guard and their ETF Viewer rating. Currently, of the six ETFs just mentioned, VectorVest only rates ESPO a “Buy” and the other five as “Holds.” Most of these had a nice “pop” in this past week which was one of the best weekly returns in many months.
My conclusion derived from reviewing only the performance data of thematic ETFs is that it is very difficult to unearth one or more that can consistently outpace either the S&P 500 Index or the Nasdaq Composite over multiple years, and even more difficult to predict the winners for the year ahead.
If an investor or trader wanted to take on more risk without having to pick one or more of these ETFs , then he or she could consider the S&P 500 and Nasdaq 100 leveraged ETFs, either in the double or triple beta modes. Any of those would have outpaced any of these theme-based ETFs over multiple years, even on a buy-and-hold basis (which is not recommended because of the negative drawdowns).
A few of their leveraged tickers are TQQQ(3x), QLD (2x), SSO(2), UPRO(3x), and SPXL(3x). Of course, you will need to have tight risk control, get the timing right, and use your technical tools and VectorVest signals to get the best results. In any event always remember Caveat emptor.


Want These Types of Insights at Your Fingertips so You Can Win More Trades?
Use VectorVest to Analyze any stock free. VectorVest is the only stock analysis tool and portfolio management system that analyzes, ranks and graphs over 18,000 stocks each day for value, safety, and timing and gives a clear buy, sell or hold rating on every stock, every day.
Before you invest, check VectorVest! Click here to ANALYZE ANY STOCK FREE and see our system in action!


Leave A Comment