by Leslie N. Masonson, MBA
In 2006, a handful of equity leveraged ETFs came to market. And over the years the number has expanded to the current 154 with assets under management of $70.3 billion with an average expense ratio of 1.03%. They come with various levels of leverage from 1.5, 2 and 3 times their underlying benchmark. There are both bullish (long) and bearish (short) ETFs, and the later are also called inverse ETFs (known Contra ETFs in VectorVest). These ETFs increase in price when their benchmark falls. This article will solely focus on the bullish ETFs, as a follow-up article will review the bearish ones.
The two major leveraged/inverse sponsors are Direxion with 46 ETFs valued at $22.3 billion AUM, and ProShares with 73 ETFs with $41.1 billion AUM. The remaining smaller leveraged ETFs sponsors include: Rex Microsectors (7 ETFs and $2.0 billion AUM), AdvisorShares (2 ETFs and $134 million AUM), Etracs (14 ETFs and $358 million AUM).
Aggressive self-directed investors and traders searching for mind-blowing returns with extreme volatility have the opportunity to engage their passions using leveraged ETFs. These individuals may be full- or part time players, and they may be willing to place small bets such as 1-2% of their portfolios in these vehicles. More venturesome players may just day or position trade them with a much larger percentage of their cash. But that is an extreme and is to be avoided by 99% of investors and traders.
One thing is for certain. Leveraged ETFs should not be part of most investors’ portfolios, as they can skyrocket in price if you are long and the market rises, but they can collapse quickly and viciously if the market reverses. You need to be highly disciplined, unemotional and have strict risk rules in place to avoid large losses.
Most importantly, these ETFs offer their stated leverage ratio only on a one-day basis, as the pricing is reset every day. This means that if you buy a bullish ETF (long) such as Proshares UltraPro QQQ (TQQQ) — 3X the QQQ — will rise 3% when the QQQ rises 1% and lose 3% when the QQQ’s declines 1%. Over periods longer than a day this 3:1 relationship will not hold up, especially in both a trading range and declining market scenario. In both these cases, TQQQ will do poorly and lose value quickly, as the ETF’s price decays. There is a daily reset each night where the price is reset to its underlying benchmark so the fixed ratio (for example 3:1), is maintained going forward.
The TQQQ is called a triple leveraged ETF, as well as other monikers such as or 3X ETF or 3 Beta ETF. Those designations all mean the same thing – triple leverage of the underlying benchmark QQQ, in this case. The same classification and labels apply to the double leveraged ETFs.
It is interesting to note that Direxion offers only five market-weighted 3X ETFs, which are: S&P Midcap 400 (MIDU), Russell 2000 (TNA and TZA), and S&P 500 (SPXL and SPXS). They do not offer a leveraged ETF for the Dow Jones Industrial Average or the NASDAQ-100.
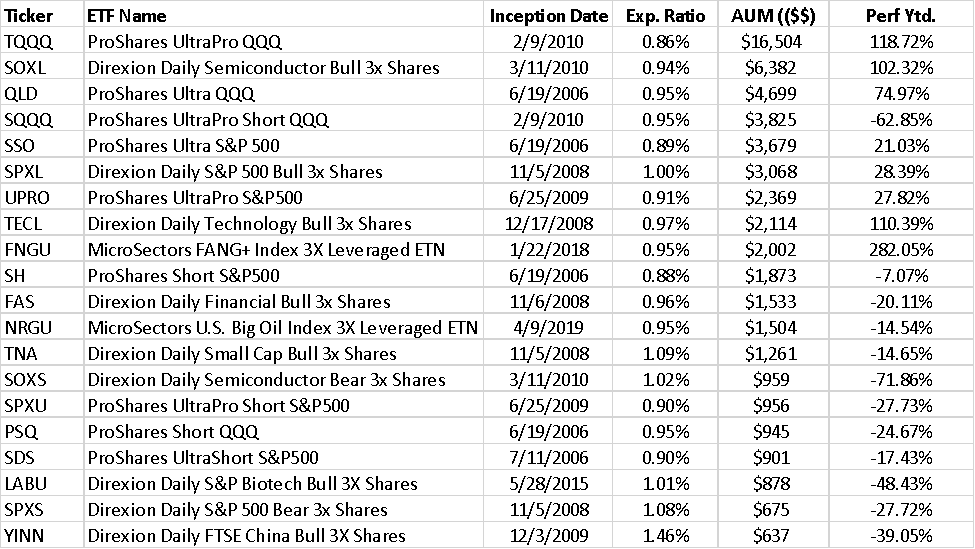
However, ProShares has ETFs for both. Note in the table below that TQQQ has racked up a gain of 118.7% as of October 6, 2023, and its bear 3X cousin SQQQ is down 62.9% for the same period. Obviously, being on the wrong side of the trend, and holding on for dear life, is a fiasco for a buy-and-hold investor.
The 20 largest leveraged ETFs, as of October 6, 2023 are as follows:
.
Of the top 20 ETFs ranked by AUM, there are seven inverse ETFs. They all suffered the consequences of a rising market. Four bullish ETFs gained more than 100% so far this year. By far the clear winner was FNGU (Microsectors Fang +3xETN) which is a 3X Fang ETF with a phenomenal return of 282%.
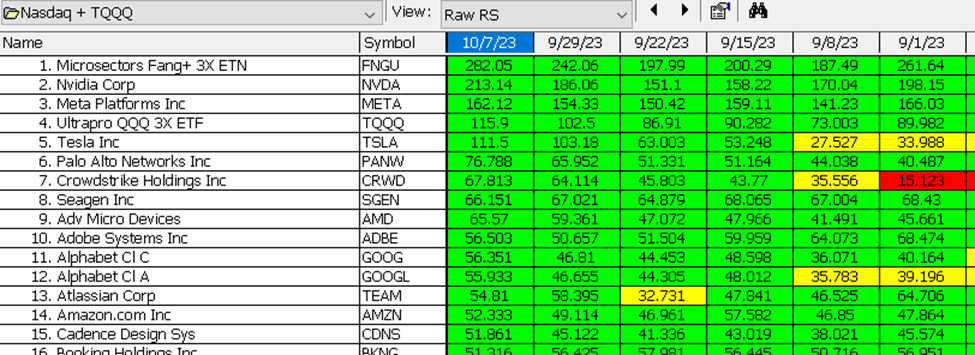
The table below shows a portion of a performance for 2023 through October 6 for the NASDAQ-100 with FNGU and TQQQ embedded in the data for comparative purposes. Why did I place their tickers on the table? I wanted to point out how well 3X ETFs perform in a bull run against all the other 100 stocks. FNGU ranked #1 with a 282% gain much higher than NVDA’s gain of 213%, and TQQQ ranked 4th with 116%, but below META’s 162%.
Both these two ETFs performed better than TSLA at 112%, Alphabet at 56%, Amazon at 52.3%, and Apple 36.6% (not shown on table). My point is that in a bull market you don’t have to try to pick the winning stocks which is very difficult. The triple leveraged ETFs offer the best bang for the buck and produce gains that are usually in the top 5 rankings of the table. I also added the ticker for the FNGD (not shown) which is the 3X bear cousin of FNGU. For the YTD, it declined 85% which is a distressing situation for any buy-and-hold bears. Moreover, SQQQ declined 64.2%. Leverage is a killer if not managed properly.
Of course, in past few weeks (ending October 6), as the general market declined, the tech-focused ETFs held up well. FNGU was up 11.3%, NVDA was up 10.0%, TSLA gained 6.4%, GOOG was up 5.6%, Meta gained 5.5%, TQQQ was up only 4.8% (because of daily price reset and the multi-day declines), APPL was up 1.5%, AMZN was down 0.89%. So even in a mildly rising sector, these ETFs held their ground. As expected TQQQ did not do as well as the more concentrated Magnificent 7 play FNGU ETF.
Anyone interested in learning more about these ETFs should check out the prospectus, fact sheet, and other material at the sponsor firm’s site. Make sure you understand how the ETF operates, and especially their discussion of daily price reset and compounding which have major impacts on future daily prices. And then use the ETF viewer to determine the top ranked ETFs according to VectorVest to make your final decision.


Want These Types of Insights at Your Fingertips so You Can Win More Trades?
Use VectorVest to Analyze any stock free. VectorVest is the only stock analysis tool and portfolio management system that analyzes, ranks and graphs over 18,000 stocks each day for value, safety, and timing and gives a clear buy, sell or hold rating on every stock, every day.
Before you invest, check VectorVest! Click here to ANALYZE ANY STOCK FREE and see our system in action!


Leave A Comment