Tuesday morning, Airbnb (ABNB) reported Q3 earnings that exceeded not just analyst expectations – but the company’s best performance to date. It was the biggest and most profitable quarter in company history, and yet, shares are trading down 10% so far today…what’s going on?
Before we can look at potential causes for the drop in stock price despite an impressive quarter, let’s look at the earnings release itself. The net income for Airbnb came in at $1.2 billion, up substantially from the previous year’s 3rd quarter (just $834 million). Just about all the other KPIs at Airbnb rose as well.
This results from a return to normalcy in our country, as pandemic fears dwindle and cross-border travel resumes. Nightly bookings and experiences were up big during the quarter – especially in the Asia Pacific region. This was a region that was hit the hardest by restrictions, and the 3rd quarter brought about a 65% spike in bookings there. Overall, the company saw a 25% increase in bookings year over year.
Meanwhile, supply was up too. More hosts made their way to Airbnb, resulting in 15% more active listings. Again – this is likely the result of pandemic fears dwindling, and hosts being more comfortable sharing their space with others. But it’s also the result of an uncertain economic future, as a recession continues to loom on the horizon. The company states that this surge in hosting is very similar to what it saw during the great recession of 2008.
Looking ahead to the 4th quarter, Airbnb does expect to take a step back – with lower revenue anticipation than the 3rd quarter. This is merely the result of seasonality, as historically, the 3rd quarter is Airbnb’s best in the calendar year. And, this outlook could be partially to blame for the drop in Airbnb stock price over the past 2 days of trading.
This is coupled with the fact that analysts still maintain their stance that Airbnb as a company is volatile. And, recessionary concerns are undoubtedly playing a role in the overall market sentiment around the company.
If you’re currently invested in Airbnb or looking to find an opportunity here, you’re in luck. We can help you tune out all the noise and just get to what matters most from a stock analysis standpoint. See what the VectorVest stock analysis software has to say about the current state of Airbnb below to get a clear buy, sell, or hold recommendation…
Evaluating the Risk & Trend of Airbnb Stock Through the VectorVest System
VectorVest tells you everything you need to know about a stock with just three simple ratings: relative value (RV), relative safety (RS), and relative timing (RT). Interpreting these ratings is straightforward, as they sit on a scale of 0.00-2.00. The closer to 2, the better, and vice versa.
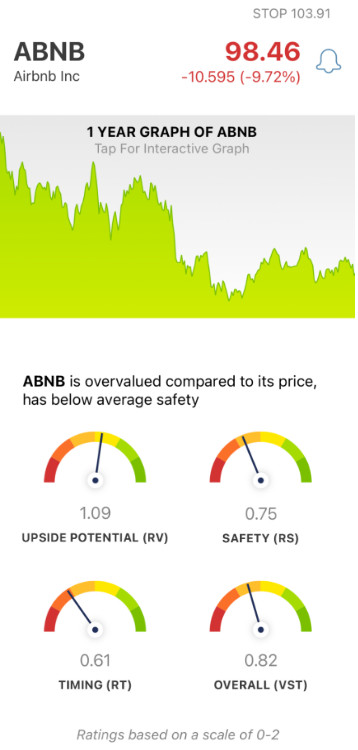
The best part is that together, these ratings contribute to an overall VST rating – along with a clear recommendation on what investors should do at any given time. As for ABNB, here’s what the system shows now:
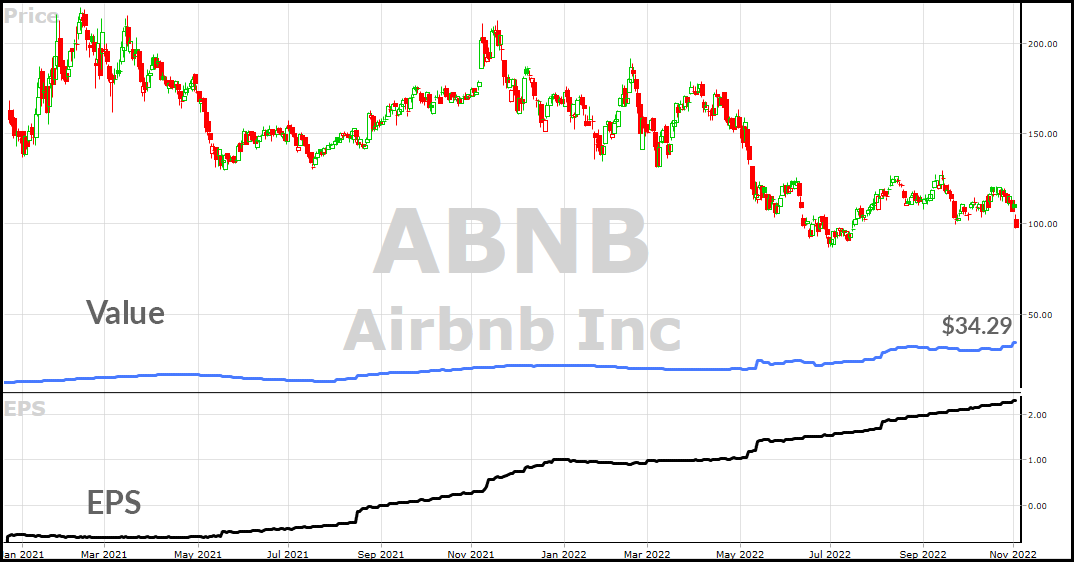
- Fair Upside Potential: Taking a look at the long-term price appreciation potential up to three years out, VectorVest shows a fair RV rating of 1.09. But, it’s worth noting that the stock does appear to be overvalued. VectorVest calculates the current value to be $34.29 compared to the current price of $98.51.
- Poor Safety: The RS rating for ABNB is poor at just 0.75. This is calculated from a deep analysis of the company’s financial consistency and predictability, debt-to-equity ratio, and business longevity.
- Poor Timing: As you’ll see looking at any time frame within the last year, ABNB has a long-standing negative price trend. And, it’s only been exacerbated over the past few days. This contributes to a poor RT rating of just 0.61 – which is based on the direction, dynamics, and magnitude of the stock’s price movement. VectorVest looks at price trends not just in the short term, but also in the mid-to-long term.
These three ratings work out to an overall VST rating of just 0.82 – which is poor on a scale of 0.00-2.00. But, does that necessarily mean it’s time to sell off your shares of ABNB? Or, should you wait a bit longer to see if the company can finally turn things around?
You can get a clear answer on your next move with just a quick click – get your free stock analysis here to eliminate any guessing games or emotion from this decision!
You don’t have to wonder any longer – get a free stock analysis today and discover a clear answer to what you should do with SAM!


Want These Types of Insights at Your Fingertips so You Can Win More Trades?
Use VectorVest to Analyze any stock free. VectorVest is the only stock analysis tool and portfolio management system that analyzes, ranks and graphs over 18,000 stocks each day for value, safety, and timing and gives a clear buy, sell or hold rating on every stock, every day.
VectorVest advocates buying safe, undervalued stocks, rising in price. As for ABNB, it has fair upside potential – but it’s overvalued, and it has poor safety and timing.
Before you invest, check VectorVest! Click here to ANALYZE ANY STOCK FREE and see our system in action!


Leave A Comment