
In its February 3 earnings release, ArcBest announced its full-year 2022 revenue totaled a record $5.3 billion compared to $4.0 billion in 2021. That caused the stock to have a wild ride where it traded between an intra-day low of $78.37 to a high of $89.69, before closing that day at $86.70. Over the next few days, it hit $103.57, before settling back and closing at $100.80 on Friday.
ArcBest® (Nasdaq: ARCB) is a multibillion-dollar integrated supply-chain logistics company, based in Fort Smith, Arkansas that offers shipping and logistics technology. The company was born in 1923 as a homegrown freight hauler known as OK Transfer. In 1966, the company changed its name to Arkansas Best Corporation, after a few acquisitions. In 2014, after additional purchases, it changed its name to ArcBest Corporation. Today, ARCB is a logistics leader with over 15,000 employees across over 250 locations.
They reported fourth-quarter 2022 revenue of $1.2 billion, showing an increase of $59.0 million compared to the fourth quarter of 2021. They also delivered a fourth-quarter 2022 net income of $37.3 million, or $1.48 per diluted share. And for the full year, 2022 generated a net income of $298.2 million, or $11.69 per diluted share. This was their second consecutive year of record-setting numbers. Additionally, ARCB gave back $76 million to shareholders via a stock repurchase program and dividends paid ($0.48 per share a year). ARCB has a P/E ratio of 9.07, well below the P/E ratio of 47.58 for all the VectorVest database stocks.
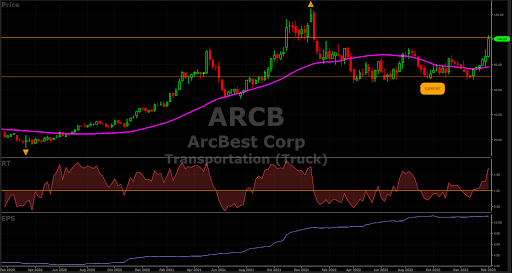
ARCB stock has been in a trading range of approximately $70 to $100 since March 2021 with a big run-up starting in early January 6, 2022, peaking at $125 intra-day, then declining to $70 and hitting that level six additional times making it a solid support zone. The latest February 3 earnings report caused the stock to spike 20% higher in a few days. As the accompanying chart shows, ARCB closed on Friday just $7 below its recent multi-year high on January 17, and it is comfortably above its 40-day moving average. ARCB is ranked #1 in the VectorVest Truck Transportation industry segment encompassing 25 companies, and more impressively as #1 in their larger Transportation sector with 156 companies.
Exceptional VectorVest Scores Projects a Bright Future
The VectorVest ratings of ARCB are as follows:
- Excellent Upside Potential: The Relative Value (RV) rating focuses on a stock’s long-term, three-year price appreciation potential. The current RV rating for ARCB is 1.42 – appreciably above the 1.00 level on a scale of 0.00-2.00. VectorVest’s current value of the stock is $115.65 well-below its current price of $100.80; therefore it is considered undervalued, with room to run towards its December 27, 2021, closing all-time high of $125.00, about a 25% jump from its current levels.
- Fair Safety: The Relative Safety (RS) rating is based on the company’s business longevity, financial predictability/consistency, debt-to-equity ratio, and additional risk parameters, including price volatility. The RS rating of 1.07 is slightly above average, indicating minimal risk.
- Excellent Timing: The Relative Timing (RT) rating focuses on the price trend over the short, medium, and long term. The components include price direction, dynamics, and price magnitude of price changes over daily, weekly, quarterly, and yearly comparisons. ARCB has a powerful and well above-average RT rating of 1.55. That means that this stock is in the top 1% of all 9153 stocks based on its timing ranking.
- Poor Comfort Index: This index measures the consistency of a stock’s long-term resistance to severe and lengthy corrections. This index compares the individual stock to the fluctuation of the VectorVest Composite price that is measured on a scale of 0 to 2.00. At a level of 0.55, ARCB is about the median of all rated stocks. Therefore, this stock may not be suitable for long-term conservative investors.
- Excellent Earnings Growth Rate (GRT): ARCB’s 5% forecasted growth rate is well above average and is measured over a forecasted three-year period. This fundamental factor is calculated in the VectorVest software, so you don’t have to do the work. A 3-year chart highlights the up-trending earnings with an accelerating move higher after each earnings release since May 2020.
- Excellent VST Score: The VST Master Indicator ranks 9,153 stocks from high to low and brings to the top of the rankings those stocks with the highest VST scores. ARCB’s exceptional score is 1.37which is the 5th best in the entire database, quite an accomplishment. Using VST enables users to determine stocks that are performing much better than average, as well as the opportunity to find the cream of the crop in all its critical criteria with a few mouse clicks.
Considering the high VectorVest scores, is this a safe time to buy ARCB, as it has just catapulted by 32% since January 6, thus stretching it way above its 40-day moving average (on a daily chart)? On the other hand, is it about to give back some of those recent gains to test the $70 support level again, before its next move higher? Check out VectorVest’s buy, sell, and hold rating on this stock before making any move along with all the critical numbers on the stock. To see the ARCB rating you can analyze ARCB free using VectorVest to get the recommendation.


Want These Types of Insights at Your Fingertips so You Can Win More Trades?
Use VectorVest to Analyze any stock free. VectorVest is the only stock analysis tool and portfolio management system that analyzes, ranks and graphs over 18,000 stocks each day for value, safety, and timing and gives a clear buy, sell or hold rating on every stock, every day.
Before you invest, check VectorVest! Click here to ANALYZE ANY STOCK FREE and see our system in action!


Leave A Comment