By Leslie N. Masonson, MBA
Celestica Inc. (CLS), is a NYSE-listed firm incorporated in 1996 headquartered in Toronto, Canada. Therefore, American investors are probably not familiar with this company which doesn’t get coverage in the U.S. financial media. Because of its future prospects based on its growing earnings and 85% price appreciation over the past year, investors should keep CLS on their radar.
The company offers supply chain guidance and products to clients in Asia, Europe, and North America. Cloud-based companies, industrial firms, defense and OEMS are examples of its customers. Celestica currently employs 20,611 individuals. There are 115 million shares outstanding. Revenues totaled $7.74 billion, and CLS’s market cap is $2.5 billion.
The stock has a following by 244 institutions, mostly Canadian firms, owning 77.6% of the outstanding shares, while insiders own only 1.3%. However, two U.S. institutions own shares –Vanguard owns about 8% in various mutual funds, and Dimensional Funds Advisors owns 3.5%.
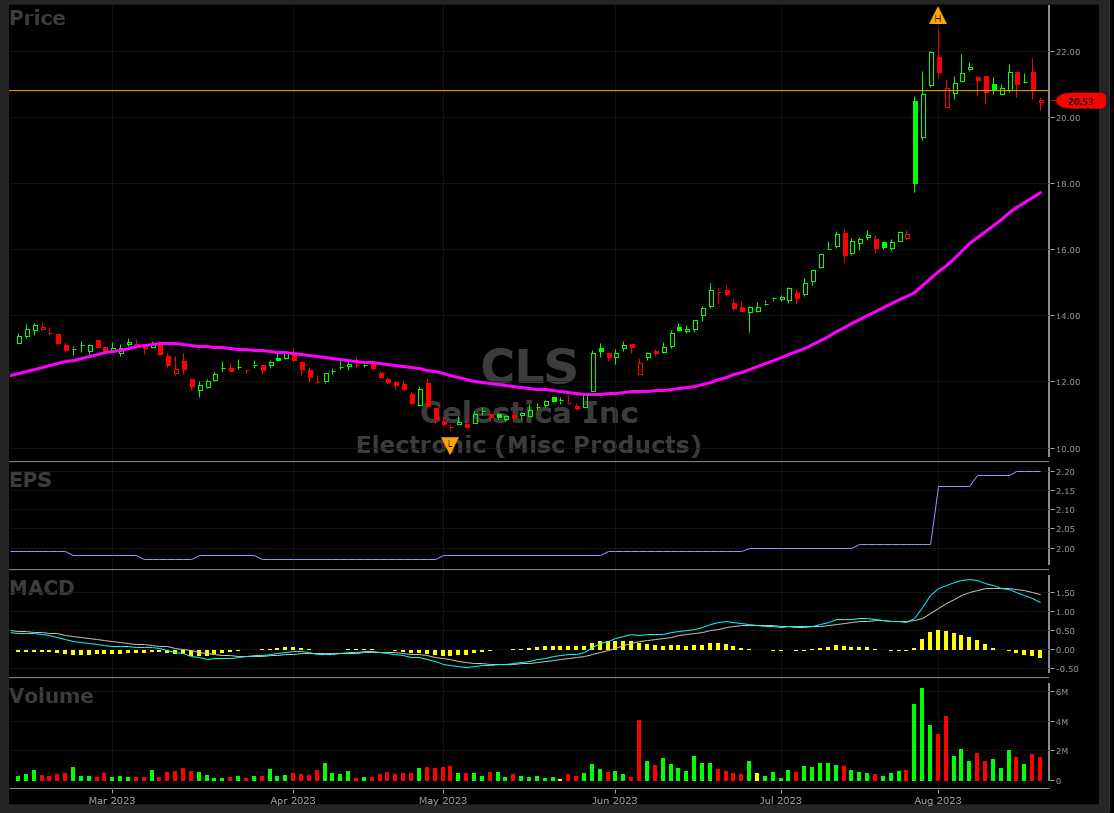
Since its March 18, 2020 low of $2.63, the stock has advanced to an all-time high of $22.68 on August 1, but since then has been consolidating and is hovering around $21. This 29 months advance totaled 762%, certainly a spectacular run. As the accompanying chart shows, the price broke out of three-year trading range of $8 to $13.40 on June 20 and has been on a tear, especially after its July 27 earnings release, when the stock shot up to an all-time high.
CLS resides in VectorVest’s Electronics (Misc. Products) grouping and is rated #1 out of 46 companies. Moreover, it is also ranked #1 in the broader Electronic sector out of 250 stocks which is even more impressive. Note that the Electronic (Misc. Products) group itself is ranked only 162 in Relative Timing (RT) out of 222 tracked industries. That is not a plus, as it is more desirable to invest in companies with high industry group rankings, since groups usually carry the strong and weak players with it. Yet, CLS appears to be a “star” performer on its own, bettering the group’s performance.
Celestica Sports Very High VectorVest Scores, Is Undervalued and Has Been a Top Market Performer Since The Latest Earnings Release
The VectorVest software issues a clear buy, sell, or hold recommendation on all the 9,131 stocks and ETFs. This is accomplished through the use of a proprietary stock rating system that boils down everything you need to know into three simple ratings. These are relative value (RV), relative safety (RS), and relative timing (RT). Each is measured on its own scale of 0.00-2.00, with 1.00 being the average for quick and easy interpretation.
As for CLS, its current ratings are as follows:
- Very Good Upside Potential: The Relative Value (RV) rating focuses on a stock’s long-term, three-year price appreciation potential. The current RV rating for CLS is 1.31 which is above average. The current stock price is $20.53, while VectorVest places its value at $24.50, indicating a potential 19% upside, if it attains that value.
- Fair Safety: The Relative Safety (RS) rating is based on the company’s business longevity, financial predictability/consistency, debt-to-equity ratio, and additional risk parameters, including price volatility. Its RS rating of 1.03 is slightly above average, indicating average risk.
- Excellent Timing: The Relative Timing (RT) rating focuses on the price trend over the short, medium, and long term. The components include price direction, dynamics, and price magnitude of price changes over daily, weekly, quarterly, and yearly comparisons.CLS has a very high RT rating of 1.70 compared to the average of 0.94 for all the stocks in the database which means that the stock has been a superior performer over multiple timeframes. Moreover, its RT ranking is in the top 1% for this metric.
- Excellent Comfort Index: This index measures the consistency of a stock’s long-term resistance to severe and lengthy corrections. This index compares the individual stock to the fluctuation of the VectorVest Composite price. CLS’s rating of 1.55 is significantly above average and also in the top 1% of the universe.
- Very Good Growth Rate (GRT): CLS’s current sales growth over the last 12 months is 13%, with an accompanying 20% strong forward-looking earnings growth rate. The latter is measured over a forecasted three-year period. As these important fundamental factors are captured in the VectorVest software, you can quickly get a picture of the company’s fundamental measurements with a few mouse clicks.
- Excellent VST Score: The VST Master Indicator ranks 9,131 stocks from high to low with those stocks with the highest VST scores at the top of the list. CLS’ VST is 1.39, which is well above average. Moreover, this stock is ranked #20 in VST out of 9,131 in the VectorVest database which means it is in the top 0.2% of all stocks, quite an achievement. Using VST enables subscribers to identify stocks that are performing much better or worse than average, and CLS is clearly in the former category.
To sum up, the excellent metrics indicate that CLS has the potential to go higher, but like all stocks, needs a positive trending market. During the past few weeks, the market had taken a 5% hit, but CLS has actually jumped 25% and held its gain during this period which is a big plus. Moreover, as the chart below shows, there has been a huge increase in trading volume since its July 27 positive earnings report, peaking at over 6 million shares on July 28, but still averaging close to 2 million shares since then. This means that the stock is under accumulation by institutions which is a sign that they also expect a positive road ahead for the company.
If you're considering adding CLS to your portfolio, ensure that the market is in an uptrend – though it's not the case currently. Also, check CLS's MACD for positivity (which is not the case now), and watch for the price to break above the $22 resistance level (currently below). Once you've purchased the stock, remember to place a stop loss order just below $18, which represents the recent gap up price bottom. Notably, the stock is comfortably above its 40-DMA, a significant positive in a market where the major averages are below their 50-DMAs.
Based on these mixed factors, now is a propitious time to take a 30-day trial to VectorVest, to make sure the Daily Color Guard is on a “BUY” signal which is not the current cast.


Want These Types of Insights at Your Fingertips so You Can Win More Trades?
Use VectorVest to Analyze any stock free. VectorVest is the only stock analysis tool and portfolio management system that analyzes, ranks and graphs over 18,000 stocks each day for value, safety, and timing and gives a clear buy, sell or hold rating on every stock, every day.
Before you invest, check VectorVest! Click here to ANALYZE ANY STOCK FREE and see our system in action!


Leave A Comment