
Chubb Limited (CB:NYSE) is the global leader, and largest publicly traded provider of property and casualty insurance in the world, as well as provider of reinsurance, health, accident, and life insurance with operations in 54 countries and territories. The company headquarters is based in Zurich, Switzerland and there are 34,000 employees with annual revenues of $41 billion.
Interestingly, the current March 6, 2023, issue of Barron’s has a one-page article written by Andrew Bary titled “Insurance Isn’t Always Dull. Chubb Stock Is a Buy” indicating “…there is a lot to like about Chubb.” He reviews a host of fundamental issues including earnings, underwritings, valuation, etc., as well as comments from CEO Evan Greenberg. What isn’t mentioned is the technical condition of the stock and whether or not it is a technical buy based on its own chart pattern and the overall market trend. This is exactly where VectorVest shows its power and where it takes the emotion out of the equation. VectorVest first recommends determining the market’s trend overall by utilizing the Daily Color Guard, and then crunches the numbers in the database of 9,147 stocks, based on both fundamental and technical factors, to assign each one with a Buy, Sell or Hold recommendation. There is no guessing involved or basing decisions on analyst opinions. We’ll review the VectorVest ratings for CB shortly, but first let’s review the contents of the recent January 31, 2023 earnings report press release.
The release highlighted the firm’s financial condition as of December 31, 2022, that indicated that full year net income was $5.31 billion compared to $8.54 billion, a year earlier, down a whopping 37.8%. However, full year consolidated premiums written jumped 10.3% from the prior year, and full-year property and casualty income was up 23.2%. Their release stated: “Net income in the quarter was adversely impacted by adjusted net realized losses of $363 million after tax, principally due to the mark-to-market impact on private equities.” Moreover, “At December 31, 2022, the investment portfolio was in an unrealized loss position of $7.28 billion, compared with an unrealized gain position of $2.26 billion at December 31, 2021.” At the upcoming 2023 Annual General Meeting, Chubb is recommending that shareholders approve its 30th consecutive yearly dividend increase to $3.44 per share, where the quarterly dividend will be available to shareholders of record on March 17, 2023.
VectorVest ranks CB #26 in its universe of 65 property and casualty insurance companies, and 53rd out of 128 stocks in the general insurance category. So, CB is not at all a top-ranked stock measured by compared to other insurance companies. CB has a very low P/E ratio of 11.58 compared to 48.03 for those companies in the VectorVest database. Moreover, it has a forecasted earnings per share of $17.88 for the next year ahead. Its annual sales growth is about 10% a year which is considered good. Currently, CB pays an annual dividend of $3.22 or 1.60% on a yield basis which exceeds that of 1.12% that is the average stock’s yield in the database. The average daily trading volume over the 50-day is a respectable 1.68 million making it easy to get a favorable execution price.
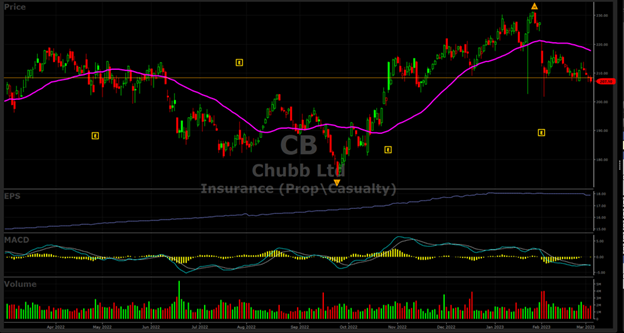
The stock hit an all-time high on January 26, closing at $231.11, then quickly sank 10 % to its current price of $207.10 on an unusual down gap down on February 1 and 2 before recovering a bit, and then sinking again ending last week. The stock had a great run from September 16, 2022, to its high advancing from $173.78 to $231.11 a run of 33% but has since given back the 10% mentioned above. Currently, the stock price is below the critical 40-day moving average which is not the case for the popular S&P 500 Index or the Nasdaq Composite.
CB’s Mediocre VectorVest Scores Offers a Mixed View of its Future Prospects
The VectorVest ratings of CB are as follows:
- Good Upside Potential: The Relative Value (RV) rating focuses on a stock’s long-term, three-year price appreciation potential. The current RV rating for CB is 1.09– slightly better than average on a scale of 0.00-2.00. VectorVest’s current value of the stock is 211.86, slightly below its current price of $207.10; therefore it is considered undervalued, but with room not much to run higher.
- Good Safety: The Relative Safety (RS) rating is based on the company’s business longevity, financial predictability/consistency, debt-to-equity ratio, and additional risk parameters, including price volatility. The RS rating of .1.16 is slightly above average, indicating slightly above average risk.
- Fair Timing: The Relative Timing (RT) rating focuses on the price trend over the short, medium, and long term. The components include price direction, dynamics, and price magnitude of price changes over daily, weekly, quarterly, and yearly comparisons. CB has a below above average RT rating of 0.92 compared to the average 0.99 RT of all the stocks in the database. Also, the MACD indicator in the chart is still in a downward sloping trend.
- Poor Comfort Index: This index measures the consistency of a stock’s long-term resistance to severe and lengthy corrections. This index compares the individual stock to the fluctuation of the VectorVest Composite price that is measured on a scale of 0 to 2.00. At a level of 0.72 CB’s rating is significantly below average. Therefore, this stock may not be even suitable for the most conservative investors.
- Good Earnings Growth Rate (GRT): CB’s decent 11% forecasted growth rate is measured over a forecasted three-year period. This fundamental factor is calculated in the VectorVest software, so you don’t have to do the work. The chart below highlights the up-trending earnings with an accelerating move since February 2021 (not shown) as the chart is more current.
- Fair VST Score: The VST Master Indicator ranks 9,167 stocks from high to low and brings to the top of the rankings those stocks with the highest VST scores. CB’s average score is 1.05 which is the upper 10% of the entire database, not one to write home about. Using VST enables users to identify stocks that are performing much better than average, as well as the opportunity to find the cream of the crop in all its critical criteria with a few mouse clicks. This stock is currently not in that category even though recommended by Barron’s (March 6, 2023) as “buy”.
Considering the uninspiring VectorVest scores and its latest earnings, is this really a good time to buy CB, as Barron’s suggests? It might be a good time to jump in now, as the stock has just dropped 10% from its recent high, but a savvy investor should wait for the appropriate timing signal which VectorVest provides on a daily basis. Check out VectorVest’s current recommendation on this stock before making a mistake, as far as timing is concerned. To see the CB rating you can analyze it free using VectorVest to get the current recommendation.


Want These Types of Insights at Your Fingertips so You Can Win More Trades?
Use VectorVest to Analyze any stock free. VectorVest is the only stock analysis tool and portfolio management system that analyzes, ranks and graphs over 18,000 stocks each day for value, safety, and timing and gives a clear buy, sell or hold rating on every stock, every day.
Before you invest, check VectorVest! Click here to ANALYZE ANY STOCK FREE and see our system in action!


Leave A Comment