Early this morning news of Wells Fargo downgrading Costco hit the digital world. Investors responded by selling off company shares, resulting in a 2% loss as of 11 am EST. What exactly did Wells Fargo see that resulted in this downgrade, and what should you do next as an investor? We’ll cover all this and more below…
Edward Kelly – an analyst at Wells Fargo – dropped his price target from $600 to just $490. He cited a few hurdles on Costco’s horizon that worry him – and he feels that the rest of the market should also take heed.
For one, Kelly cited slow price increases in food. This is coupled with weakening consumer spending as recession fears continue to loom. Meanwhile, fuel margins appear to be pulling back as gas prices start to return to a normal state. This will take a serious toll on Costco’s fuel segment. To top things off, Kelly feels that Costco faces currency exposure.
Kelly finished off his release by stating that he sees more risk than upside potential in the near term for Costco. And with the current valuation it has, this doesn’t bode well for investors.
With that said, there are a few positives he points to. It appears that membership fees are set to increase in the coming year. There also looks to be a special dividend approaching in 2023, which will provide some degree of support for the stock. However, this is all up in the air right now – and even if both of these occurrences prove true, the upside potential doesn’t outweigh the risk.
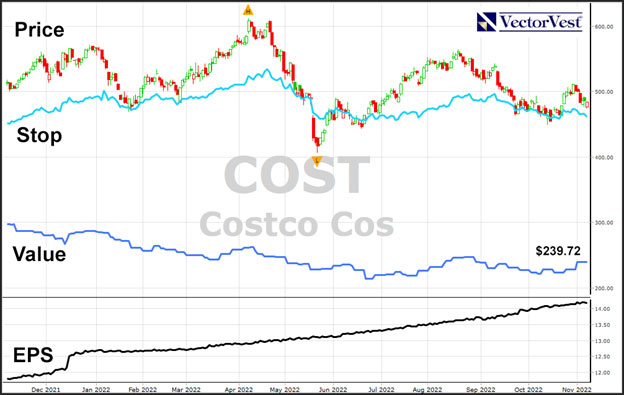
Looking at the past year for COST stock, share prices have been volatile. The company has only dropped 6% in the past 365-day period which beats the market average. But, there have been quite a few peaks and valleys along the way. Shares reached a high point of $608/share in April of 2022 and fell to just $416/share a month later in May. In the past week, the stock has slid just about 5%.
So, what should investors do with Costco going forward? If you have an open position right now, is it time to sell? Or, if you’re looking to get into Costco, does this low point of $480 represent a good value? Let’s take a look through the VectorVest stock forecasting system to help you make your next move in confidence.
An In-Depth Look at Costco’s Upside Potential, Safety, & Timing
VectorVest simplifies trading by telling you everything you need to know about a stock based on three simple ratings. These are relative value (RV), relative safety (RS), and relative timing (RT). Taking these ratings and forming decisions around them is effortless – as they sit on an easy-to-understand scale of 0.00-2.00. 1.00 is the average, and anything over the average indicates superior performance – and vice versa.
The best part? Based on the culmination of these three ratings, you’re given an overall rating for any given stock at any given time – along with a clear buy, sell, or hold recommendation. So, what’s the current situation with Costco?
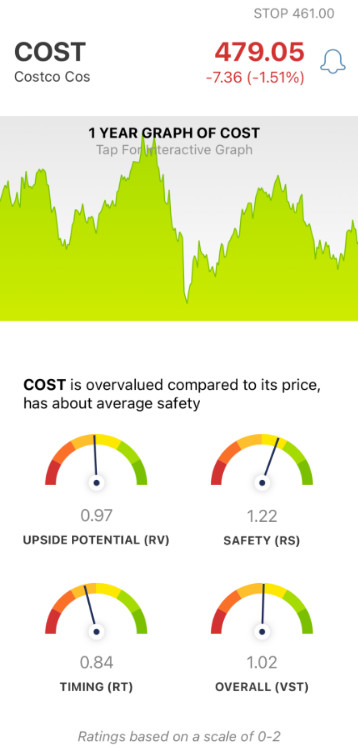
- Fair Upside Potential: The RV rating takes a look at long-term price appreciation potential up to three years out. As for COST, the RV rating of 0.97 is fair – but, the stock is overvalued. According to VectorVest, it has a current value of just $239.72 compared to a current price of $479.05.
- Good Safety: Taking a look at the risk for COST, VectorVest offers a good RS rating of 1.22. This is based on the consistency and predictability of a stock’s financial performance, debt-to-equity ratio, and business longevity.
- Poor Timing: As you can see looking at the COST stock price movement over the last few weeks and months, you can see that the timing is poor right now – and VectorVest gives an RT rating of just 0.84. This is calculated from the direction, dynamics, and magnitude of a stock’s price movement. It looks at the trend day over day, week over week, quarter over quarter, and year over year.
All this considered, the overall VST rating for VectorVest is 1.02 – which is fair. This begs the question – is there any opportunity in COST right now? Or, should you await the price trend’s reversal?
VectorVest can give you a clear answer based on these tried-and-true stock analysis strategies. No emotion, no guesswork – get your free stock analysis here to execute your decision with confidence!


Want These Types of Insights at Your Fingertips so You Can Win More Trades?
Use VectorVest to Analyze any stock free. VectorVest is the only stock analysis tool and portfolio management system that analyzes, ranks and graphs over 18,000 stocks each day for value, safety, and timing and gives a clear buy, sell or hold rating on every stock, every day.
VectorVest advocates buying safe, undervalued stocks, rising in price. As for COST, it has fair upside potential and good safety, but poor timing.
Before you invest, check VectorVest! Click here to ANALYZE ANY STOCK FREE and see our system in action!


Leave A Comment