
by Leslie N. Masonson, MBA
Eagle Materials, Inc. (EXP:NYSE), headquartered in Dallas, Texas and founded in 1963 maintains a 2,400 person workforce. Formerly, the company’s name was Centex Construction Products, Inc. with a change to the current moniker in 2014. EXP manufactures heavy construction materials and light building products. Its four main operating specialties are: recycled paper, gypsum wallboard, cement, and concrete aggregates, as well as mining limestone. On May 18, its fiscal year 2023 ending March 31, record earnings were released. Net earnings rose 23%, revenue advanced 15%, and its diluted earnings per share jumped 36%. This announcement resulted in an increase in the stock price with 642,000 shares traded, about 84% higher than normal.
On June 21, the stock hit its all-time high, closing at $176.32 on a huge 936,000 shares. Additionally, on Friday, June 23, it traded 631,000. Considering its average trading volume is 348,000 shares, the stock is most likely being bought by institutions and mutual funds, as they envision a bright future based on the company’s strong financials. The three top institutional holders are Vanguard Group, Inc. at 11.5% of the outstanding shares, followed by Blackrock Inc. at 9.1%, and FMR, LLC at 5.34%. So far, in 2023 the stock price has advanced 31.3% compared to 13.25%for the S&P 500. Currently, 513 institutions hold 95.7% of the shares so they are big players and are always looking to purchase top performers for their mutual funds and ETFs.
The general Building Sector (composed of ten industry components) is ranked #1 out of 41 sectors in the VectorVest universe. This sector had the highest VST of all sectors at 1.08, as well as the highest Relative Timing (RT) at 1.17. EXP is ranked 3rd in the Building Cement category out of 15 stocks, and 10th in the general Building Sector category out of 148 companies.
Focusing on the 222 industries tracked by VectorVest, we find that Building (Cement Etc.) was ranked #3 so it is no surprise the EXP has relatively high rankings as well. The company does pay a $1 per share annual dividend which is an added bonus, although its yield is only 0.57% due to its high price.
This is the third building stock I’ve covered in this blog. The reason is simple. Building stocks have been the top-ranked sector for months. The number one rated company in the building sector is Sterling Infrastructure (STRL) which I highlighted in a March 14, 2023 blog post, while TopBuild Corp. (ranked 4th this week) was my blog post for last week.
EXP Has Above Average VectorVest Scores, is Undervalued, in a Top-ranked Sector, and Gained 31.3% This Year – Another Building Stock To Consider
Building stock have been top performers for months and subscribers using Stock Viewer and Sector Viewer have been able to cash in on these consistent and solid performers, if they are carefully monitoring these two screeners.
VectorVest’s s key metrics for EXP are as follows:
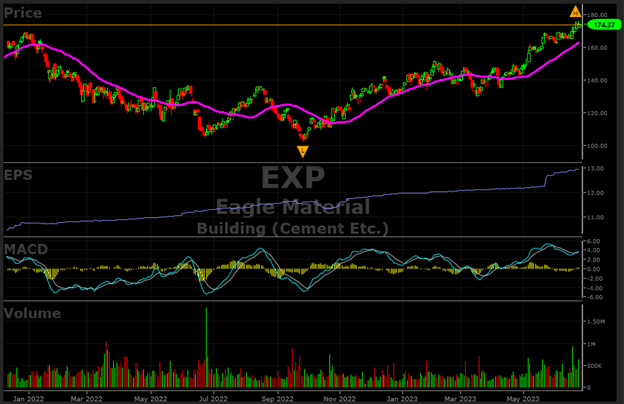
- Excellent Upside Potential: The Relative Value (RV) rating focuses on a stock’s long-term, three-year price appreciation potential. The current RV rating for EXP is 1.41 which is well above average on a scale of 0.00-2.00. The current stock price is $174.37, while VectorVest pegs its value at $225.76, so it is definitely undervalued
- Good Safety: The Relative Safety (RS) rating is based on the company’s business longevity, financial predictability/consistency, debt-to-equity ratio, and additional risk parameters, including price volatility. Its RS rating of 1.22 is slightly above average, indicating slightly below-average risk.
- Excellent Timing: The Relative Timing (RT) rating focuses on the price trend over the short, medium, and long term. The components include price direction, dynamics, and price magnitude of price changes over daily, weekly, quarterly, and yearly comparisons. EXP has an exceedingly high RT rating of 1.52 compared to the average of 0.93 for all the stocks in the database which means that the stock has been a much better performer over multiple timeframes than the majority of stocks.
- Very Good Comfort Index: This index measures the consistency of a stock’s long-term resistance to severe and lengthy corrections. This index compares the individual stock to the fluctuation of the VectorVest Composite price that is measured on a scale of 0 to 2.00. At a level of 1.39, EXP’s rating is well above average. Therefore, this stock is well suited for conservative investors.
- Very Good Growth Rate (GRT): EXP’s 17% forecasted growth rate is measured over a forecasted three-year period. This fundamental factor is calculated in the VectorVest software, so you don’t have to do the work. The chart below highlights the multi-year positive earnings trend which has been rising steadily over timely.
- Very Good VST Score: The VST Master Indicator ranks 9,115 stocks from high to low and brings stocks with the highest VST scores to the top of the list. EXP’s VST is 1.39 which is considered a high score. Using VST enables users to identify stocks that are performing much better than average, as well as those performing much worse than average. Clearly, EXP falls in the former category.
With its top ratings, investors should consider adding EXP to their watchlist. It is noteworthy that Zachs Equity Research rated EXP a top-rated A+ momentum stock in June 16 press release. And there is an earnings call scheduled for July 27 which will impact the stock’s price action, hopefully in a positive direction.
As this stock has hit a new all-time high this past week, the odds usually favor a continued advance, as momentum feeds momentum. This past week the stock decisively broke out of its 20-day trading of $165 to $170, closing the week at $174.37. Be cognizant of a price decline to $165 which would be considered a trend reversal, as would a decline below its 40-dma currently at $163. A tighter price decline would be at $168 which is right at the 20-dma, a moving average used by many traders to exit a position if the price does not hold above it. Do not be in a rush to buy this stock, as sometimes it needs time to digest its gains. And of course, make sure VectorVest’s “Confirmed Calls” is on a BUY signal.


Want These Types of Insights at Your Fingertips so You Can Win More Trades?
Use VectorVest to Analyze any stock free. VectorVest is the only stock analysis tool and portfolio management system that analyzes, ranks and graphs over 18,000 stocks each day for value, safety, and timing and gives a clear buy, sell or hold rating on every stock, every day.
Before you invest, check VectorVest! Click here to ANALYZE ANY STOCK FREE and see our system in action!


Leave A Comment