
by Leslie N. Masonson, MBA
Gibraltar Industries (Nasdaq:ROCK), was incorporated in 1972 in Buffalo, New York where it is currently headquartered. It has $1.36 billion in annual sales and a market capitalization of 2.37 billion with 2,117 full-time employees. As a conglomerate, the company manufactures and distributes building products for the renewable energy, residential, agricultural tech, and infrastructure markets in North America and Asia. They produce and install solar panels, mail storage units, rain dispersion solutions, roof and foundations ventilation systems, roof safety kits, design and support of greenhouses, and assists commercial food and plant growers, among other products.
For its size and unique product lines, the company is popular among institutions as 362 hold 100% of their 30 million shares outstanding. The top three institutional players all hold shares including Vanguard Group Inc. with 20%, Blackrock Inc. with 17.2%, and Dimensional Fund Advisors LP with 6.1%. This substantial interest by large institutions is a big plus as those are the type of firms that can push the stock price higher as they buy more shares for their clients, mutual funds or ETFs. Currently, three analysts cover the company.
Within the past two months, the stock has had upwards earnings estimated by two analysts. Moreover, Zacks rates it as a top-tier growth company with cash flow growth of 12% and an average annual earnings surprise of 14.8%.
ROCK Inc. is probably not a well-known a name to investors which is common for mid-sized non-sexy companies, nevertheless ROCK has landed at the #1 ranking in both VectorVest’s Metal Products (Pipe/Fabrication/Misc.) business sector out of 26 companies, as well as the broader Metal Products sector of 36 companies. Moreover, the business sector is ranked 54 out of 222 industry sectors tracked by VectorVest. These are all positive factors.
ROCK’s Four “Excellent” Metric Ratings, Significant Undervaluation, and Growing Earnings Portend a Bright Future
The VectorVest software issues buy, sell, or hold recommendations on 9,127 stocks. This proprietary stock rating system splits the data into three simple ratings: relative value (RV), relative safety (RS), and relative timing (RT). Each is measured on a scale of 0.00-2.00, with 1.00 being the average for quick and easy interpretation, and 2.00 being the best.
The VectorVest ratings for ROCK are as follows:
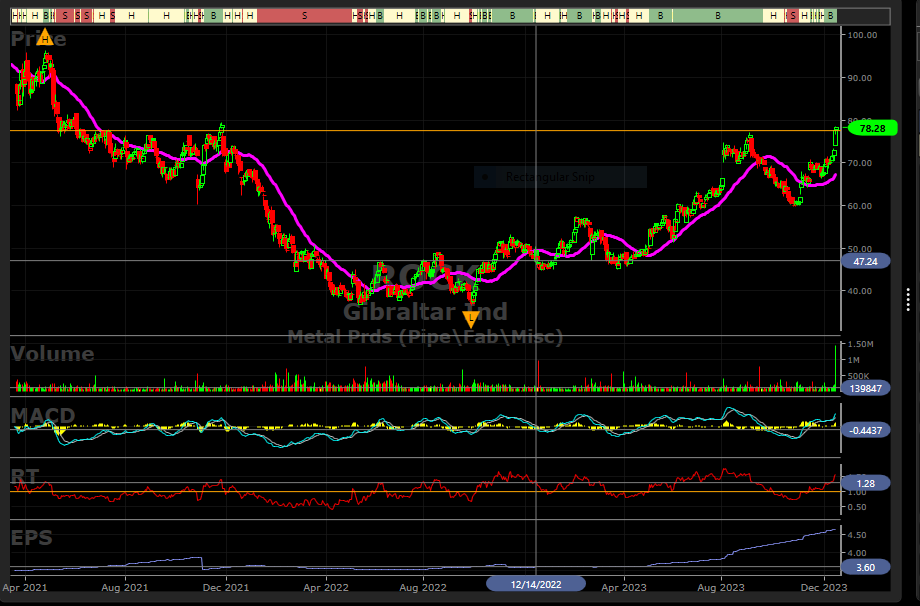
- Excellent Upside Potential: The Relative Value (RV) rating focuses on a stock’s long-term, three-year price appreciation potential. The current RV rating for ROCK is 1.41 which is exceptionally high. Moreover, VectorVest determined that ROCK is significantly undervalued with a calculated value of 98.26. Therefore, the stock can move another 24% before reaching the value placed on it from its current price of $78.28.
- Very Good Safety: The Relative Safety (RS) rating is based on the company’s business longevity, financial predictability/consistency, debt-to-equity ratio, and additional risk parameters, including price volatility. Its RS rating of 1.35 is well above average, indicating below average risk. Therefore, long-term conservative investors should be comfortable holding this stock.
- Excellent Timing: The Relative Timing (RT) rating focuses on the price trend over the short, medium, and long term. The components include price direction, dynamics, and price magnitude of price changes over daily, weekly, quarterly, and yearly comparisons. ROCK has an exceptionally high RT rating of 1.47 compared to the average 1.09 RT of all the stocks in the database.
- Excellent Comfort Index: This index measures the consistency of a stock’s long-term resistance to severe and lengthy corrections. This index compares the individual stock to the fluctuation of the VectorVest Composite price. With a CI rating of 1.40, ROCK rating is above average. Therefore, this is another positive metric indicating that it is suitable for long-term conservative investors.
- Very Good Earnings Growth Rate (GRT): ROCK has annual sales of $1.36 billion and a 17% forecasted growth rate. Unfortunately, its sales growth of 0% over the last year is very disappointing. These are just a few of the important fundamentals that are calculated in the VectorVest software.
- Excellent VST Score: The VST Master Indicator ranks 9,127 stocks from high to low and brings to the top of the rankings those stocks with the highest VST scores. ROCK’s score is 1.41 Using VST enables users to determine stocks that are performing much better than average, as well as the opportunity to find the cream of the crop with a few mouse clicks. ROCK is not at the top of the VST, but it is certainly in the top 1% of companies reviewed.
Overall, ROCK is as solid as a rock and has many positive attributes as spelled out above. It has a positive MACD, and is on a solid uptrend since November 1 taking out its September 1, 2023 recent high of$ 77.10. The next target is its all-time high of $103.02 hit on January 19, 2021. So far, in 2023 the stock price has vaulted 70.6% compared to 22% for the S&P 500, so it is a market leader in that respect.
The stock price is 16% above its 40-day moving average and the RSI at 79 is very high, but nothing to be concerned about yet. Any price decline in the next month or so below $66.71 would indicate there is more downside, and any investors should stay away at that point until it reverses and receives a VectorVest ‘Buy” signal.
With an increasing EPS trend, and a current ROE of 10.9%, this stock possesses the key characteristics of a long-term winner. However, it does not pay any dividend. The average daily volume of 157,826shares is reasonable, certainly sufficient for both traders and investors looking for a multi-year hold.
VectorVest currently rates ROCK a “Buy” as of December 1 at $69.59. Since then, the stock has moved nicely higher. Based on all the stock’s positive characteristics, this stock should be considered for immediate purchase, if interested, or placed on a watchlist waiting for a potential pullback, with a target of $103.02. A stop loss order should be entered at a comfortable, based on your risk tolerance.
You can easily check out VectorVest’s future ratings on this stock before making any move. Analyze ROCK free using VectorVest to determine the current recommendation which can change at any time based on market conditions.


Want These Types of Insights at Your Fingertips so You Can Win More Trades?
Use VectorVest to analyze any stock free. VectorVest is the only stock analysis tool and portfolio management system that analyzes, ranks and graphs over 18,000 stocks each day for value, safety, and timing and gives a clear buy, sell or hold rating on every stock, every day.
Before you invest, check VectorVest! Click here to ANALYZE ANY STOCK FREE and see our system in action!


Leave A Comment