
Monday was momentous because of the eclipse boosting hopes and dreams of disinflation, and Wednesday started with a downer because of higher-than-expected CPI data. The inflationary data came in hot, with every reading coming in above estimates, sending the market into a significant dip. Let’s dive into anticipation, the reaction, what it means, and how it changes the future outcome of the economy.
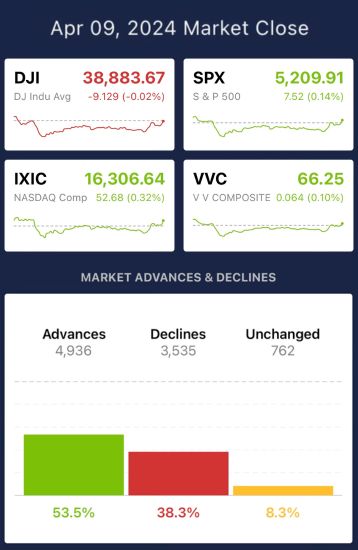
Tuesday’s market close was mixed with the Dow down 9 basis points (-0.02%), the S&P 500 up 7.52 basis points (+0.14%), and advances leading decliners by a notable margin.
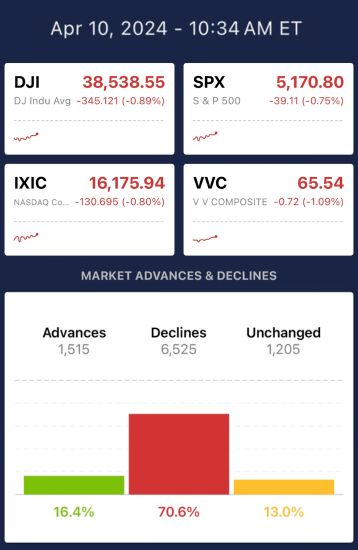
An hour into Wednesday’s session (after the CPI report), the Dow was down 345 basis points (-0.89%), the S&P 500 was down 39 basis points (-0.75%), and decliners taking over advancers by 54%.
Clearly, a large shift was seen following last night’s anticipation of the data at the close and today’s reaction following the data’s release. President Biden said after the reading, “Inflation is down more than 60% from the peak, but more is still needed.” Along with reiterating the call for companies to use record profits to cut their prices. So there’s apparent celebration due to the decline in last year’s rates, but there’s still more to understand about the state of the economy.
What did the March CPI data indicate?
The March CPI data came in at 0.4% for the month-over-month reading, 1-tenth higher than the 0.3% expectation, and 3.5% in the year-over-year reading, 1-tenth higher than the 3.4% expectation. The year-over-year number is especially concerning because it is rising. September was 3.7%, October 3.2%, November 3.1%, December 3.4%, January 3.1%, February 3.2%, and now we’re back at 3.5% in March. The acceleration does not align with the Fed’s hope for more disinflation.
The March CPI (ex-food/energy), also known as core CPI, which tracks goods and services excluding food and energy, came in at 0.4% for the month-over-month reading, 1-tenth higher than the 0.3% expectation, and 3.8% in the year-over-year reading, 1-tenth higher than the 3.7% expectation. The numbers make sense when considering the current price pressures consumers find themselves under.
The March CPI data indicates that prices are rising, continually pressuring consumers, going against the goals of the Fed, not demonstrating disinflation, and striking fear into investors as they maneuver the market. The most significant indicator is the Fed’s potential action as monetary policy is determined based on data, which keeps coming in hot.
What will happen now?
Before the start of quarter 2, the Fed made it clear it depended on data to make decisions, and the Fed needed greater confidence before cutting rates. Today’s data does not reinforce greater confidence. The market was notably weakened by the CPI data release. The market clearly dipped at the open, along with the weakening of other currencies, such as the Japanese yen. However, the global economy isn’t where investors’ heads are at, but rather, rate cuts. The new data, if echoed in the March PCE data, will encourage delayed rate cuts, meaning it won’t happen in June, and most likely only 2 rate cuts within the fiscal year of 2024. In fact, the Fed future, provided by the CME Group, now prices only 2 full rate cuts into the 2024 forecast.
What will happen now is further analysis of the data to decide what the Fed will do; If the March PCE data doesn’t paint a different story, investors can anticipate delayed and fewer cuts for 2024 forecast.
How VectorVest Helps
There’s no way to predict the PCE data, how it will impact the market, or how the Federal Reserve's decision might change based on the new data. However, there is always to stay informed amid economic uncertainties. For investors unsure of what to do in a volatile climate, it’s time to make informed investment choices. You can do that with VectorVest! Being informed regarding data metrics, market movements, and the financial health of a company is more essential than ever. VectorVest provides a definitive answer on maneuvering market sentiment with uncertainty in the wake of the Fed’s decision. These recommendations include potential investments and buy timing while also keeping a thumb on the movements of the overall market.


Want These Types of Insights at Your Fingertips so You Can Win More Trades?
Use VectorVest to analyze any stock free. VectorVest is the only stock analysis tool and portfolio management system that analyzes, ranks and graphs over 18,000 stocks each day for value, safety, and timing and gives a clear buy, sell or hold rating on every stock, every day.
Before you invest, check VectorVest! Click here to ANALYZE ANY STOCK FREE and see our system in action!


Leave A Comment