
Insight Enterprises, Inc. (NSIT:Nasdaq), headquartered in Chandler, AZ is a Fortune-ranked, #360, a company that is a solutions integrator with almost 13,500 employees worldwide engaged in 19 countries helping organizations (e.g., schools, enterprises, governments, and healthcare firms) accelerate their digital journey to modernize their business and maximize the value of technology. The company was founded in 1988 with a focus on offering hard drives by mail order. It had its IPO in January 1995. With over 33 years of IT expertise the company offers its clients comprehensive solutions to their cloud and data center transformation, digital innovation, connected workforce issues, and supply chain optimization. NSIT has been rated as a Forbes World’s Best Employer.
In its February 9, 2023 earnings release, it reported a gross profit of $421 million, an increase of 9% for the 4th quarter of 2022. Earnings from operation increased 22%. For 2023, the Company expects to deliver gross profit growth in the high single digit range and adjusted diluted earnings per share is expected in the range of $9.90 and $10.10. NSIT’s market cap is $4.83 billion.
NSIT has a low P/E ratio of 15.2, well below that of average VectorVest stock at 47.97,and quite appealing to conservative investors. Moreover, it has forecasted earnings per share of $9.42 for the year ahead. The average daily trading volume of nearly 280,000 shares is more than sufficient for obtaining favorable trade executions. Currently, 377 institutions hold most of the shares. The company currently does not pay a dividend.
VectorVest ranks NSIT #1 in its universe of 6 Retail Computer stocks, as well as #1 out of 246 stocks in the general Retail sector. That is quite a two-fold accomplishment. These high rankings are understandable with a convincing 20% sales growth over the past year, and its solid historical earnings growth.
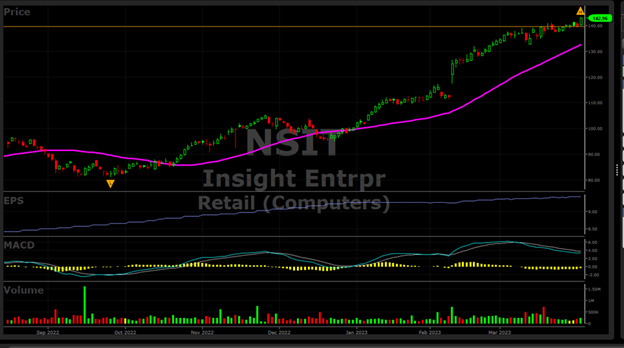
The stock price has been above its 40-day moving average since year-end 2022, and is now about 9% above it, which is not excessive by any measurement. The stock has had a great run from its recent low on October 3, 2022 at $82.44 to its all-time high on Friday at $142.96, a gain of 73.4%, while the S&P 500 Index by comparison gained only 11.7%. Whenever you see a chart have a smooth 45 degree angle uptrend like this one, you know that this stock is a gem.
Moreover, being 8th in VectorVest industry sectors out of 222, clearly brings home the point that being where the action is works well in a rising market, as we were experiencing in the beginning of 2023. Industry sector ranking is one area where VectorVest excels, and runs rings against its competitors. With a few mouse clicks, the Industry Viewer pinpoints the top industries out of a universe of 222. This screen compares all industries VST scores against each other, bringing the leaders to the top of the screen for a further fundamental and technical analysis review.
NSIT is Undervalued with Exceptional VectorVest Scores, an Advancing Stock Price with Solid Earnings Year-of-Year
Consider VectorVest’s specific evaluation of NSIT’s key metrics:
- Excellent Upside Potential: The Relative Value (RV) rating focuses on a stock’s long-term, three-year price appreciation potential. The current RV rating for NSIT is 1.41 which is much higher than average on a scale of 0.00-2.00. VectorVest’s current value of this stock is $166.66 that is significantly higher than its current price of $142.96; therefore it is considered undervalued with an excellent opportunity to continue making new highs.
- Very Good Safety: The Relative Safety (RS) rating is based on the company’s business longevity, financial predictability/consistency, debt-to-equity ratio, and additional risk parameters, including price volatility. Its RS rating of 1.31 is well above average, indicating limited below average risk.
- Excellent Timing: The Relative Timing (RT) rating focuses on the price trend over the short, medium, and long term. The components include price direction, dynamics, and price magnitude of price changes over daily, weekly, quarterly, and yearly comparisons. NSIT has a significantly high RT rating of 1.63 compared to the average 0.91 RT of all the stocks in the database. Interestingly, the chart’s MACD indicator has been is a downtrend since March 9 as the price was in a tight flat trading range, but will likely cross to the upside this week if the stock rallies.
- Fair Comfort Index: This index measures the consistency of a stock’s long-term resistance to severe and lengthy corrections. This index compares the individual stock to the fluctuation of the VectorVest Composite price that is measured on a scale of 0 to 2.00. At a level of 1.08, NSIT’s rating is slightly above average. Therefore, this stock is more suitable for aggressive investors rather than conservative investors.
- Very Good Growth Rate (GRT): NSIT’s respectable 20% forecasted growth rate is measured over a forecasted three-year period. This fundamental factor is calculated in the VectorVest software, so you don’t have to do the work. The chart below highlights the up trending earnings with a consistent step-up after each earnings release.
- Excellent VST Score: The VST Master Indicator ranks 9,137 stocks from high to low and brings to the top of the rankings those stocks with the highest VST scores. NSIT’s high score of 1.47 places it in the upper 2% of the entire database which is rarefied territory. Using VST enables users to identify stocks that are performing much better than average, as well as the opportunity to find the cream of the crop in all its critical criteria with a few mouse clicks. This stock is definitely in that category.
Considering the above average VectorVest scores and its positive earnings and price trends, this may be a good time to place NSIT on your watchlist, as it closed this past week on it's all-time high. The stock may not take a breather from its recent accelerated price action. Before you do anything, make sure that you check out VectorVest’s overall market timing signal to make sure the trend is your friend and sloping upward. And of course determine whether VectorVest ranks this stock a buy, sell or hold recommendation before making a purchase. To see NSIT’s current recommendation analyze it free using VectorVest.


Want These Types of Insights at Your Fingertips so You Can Win More Trades?
Use VectorVest to Analyze any stock free. VectorVest is the only stock analysis tool and portfolio management system that analyzes, ranks and graphs over 18,000 stocks each day for value, safety, and timing and gives a clear buy, sell or hold rating on every stock, every day.
Before you invest, check VectorVest! Click here to ANALYZE ANY STOCK FREE and see our system in action!


Leave A Comment