Yesterday after the bell Intel (INTC) shared an update on its Q1 earnings expectations that sparked concern among investors, and a sell-off ensued. The stock is down more than 10% in Friday’s trading session as a result.
Intel is forecasting revenue between $12.2 billion and $13.2 billion, below the FactSet consensus of $14.3 billion. The earnings guidance is suggesting a pending miss as well at 13 cents compared to the consensus of 34 cents.
Intel’s CFO David Zinser provided context for the lackluster performance, pointing to a few challenges in the company’s product suite. Intel Foundry Services revenue is expected to struggle as traditional packaging has seen accelerated purchasing. Zinser also warned of cyclical weakness in wafer equipment buying through Q2.
As the company’s competitors thrive amidst an AI boom, it’s fair to wonder why Intel is struggling to keep up. Still, Zinser remains optimistic about the big picture. Through 2024 the company will hone in efficiency and implement its new internal foundry model – all of which should improve transparency, accountability, and return on investment.
This news stole the spotlight from what was an excellent Q4 for Intel. The company produced a net income of $2.7 billion compared to a $700 million loss the year prior. This worked out to 63 cents a share compared to a net loss of 16 cents per share. The adjusted earnings of 54 cents outperformed the FactSet consensus of 45 cents.
The revenue boost ($15.4 billion, up from $14 billion the year prior) came from a 33% increase from its client-computing group – its largest business unit. Mobileeye revenue also gained 13% while foundry services were up 63%. These performances made up for a 10% decline in data-center and AI revenues.
INTC was on a torrent path headed into this week, up 50% since the last earnings call. But if today’s performance holds, it will mark the stock’s worst day of trading since 2021 and the first time it faced a double-digit loss over that span.
That being said, we’ve taken a look at INTC through the VectorVest stocks software and found 3 things that any investor is going to want to see…
INTC May Have Poor Upside Potential, But it Still Has Good Safety and Timing
VectorVest saves you time and stress while empowering you to win more trades with less work. It’s based on a proprietary stock rating system that gives you clear, actionable insights in just 3 simple ratings.
These are relative value (RV), relative safety (RS), and relative timing (RT). Each sits on its own scale of 0.00-2.00 with 1.00 being the average. This makes interpretation quick and easy, but it gets even easier.
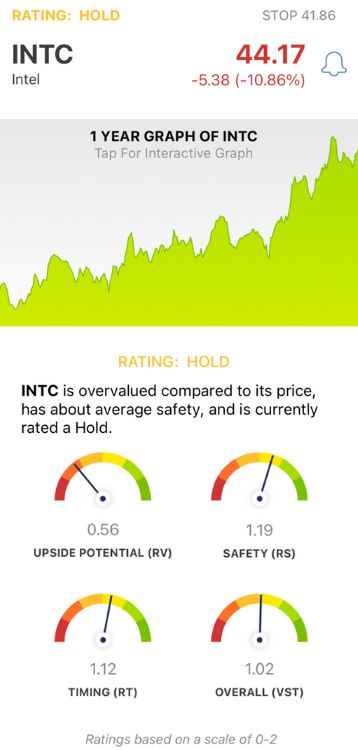
Based on the stock’s overall VST rating, the system presents a buy, sell, or hold recommendation. Here’s what we’ve uncovered for INTC:
- Poor Upside Potential: The RV rating draws a comparison between a stock’s long-term price appreciation potential (forecasted three years out), AAA corporate bond rates, and risk - allowing for much better insight than a standard comparison of price to value alone. The RV rating of 0.56 is poor for INTC.
- Good Safety: The RS rating is a unique risk indicator derived from a deep analysis of the company’s financial consistency & predictability, debt-to-equity ratio, business longevity, sales volume, price volatility, and other factors. INTC has a good RS rating of 1.19.
- Good Timing: Even with today’s poor performance, the overall price trend for INTC remains strong, bolstered by a few months of solid growth. The RT rating of 1.12 is still considered good. It’s based on the direction, dynamics, and magnitude of the stock’s price movement day over day, week over week, quarter over quarter, and year over year.
The overall VST rating of 1.02 is deemed fair for INTC, but where does that leave you as an investor? VectorVest currently rates this stock a HOLD - however, we encourage you to learn more through a free stock analysis today before you make any other moves!


Want These Types of Insights at Your Fingertips so You Can Win More Trades?
Use VectorVest to analyze any stock free. VectorVest is the only stock analysis tool and portfolio management system that analyzes, ranks and graphs over 18,000 stocks each day for value, safety, and timing and gives a clear buy, sell or hold rating on every stock, every day.
VectorVest advocates buying safe, undervalued stocks, rising in price. INTC is down more than 10% through Friday’s trading session thus far after releasing a lackluster outlook for the first half of the year, overshadowing what was a great performance last quarter. The stock may have poor upside potential, but its safety and timing are still good.
Before you invest, check VectorVest! Click here to ANALYZE ANY STOCK FREE and see our system in action!


Leave A Comment