
by Leslie N. Masonson, MBA
Cloudflare Inc. (NET), a NYSE-listed firm incorporated in 2009 and has headquarters in San Francisco. It has a workforce of nearly 3,400, revenues of $1.05 billion, and a market-cap of $21.5 billion. The firm provides globally integrated cloud-based web security and content delivery services to customers in the following sectors: healthcare, technology, financial services, retail, nonprofits, and governments.
The stock has a decent Wall Street following with 856 institutions owning 89% of the outstanding shares, but no mutual fund holds more than 4% of the stock. The stock’s 5-year monthly Beta is 0.93, so overall it moves 7% less than its benchmark. There have been a number of recent articles in the financial media and Internet about Cloudflare, mostly with positive reviews based on future projected earnings and revenue growth in a hot industry.
Be aware that the company’s next earnings date is this week on Thursday, August 3, 2023. So, pay attention to the report to see if the financials are improving. Analyst consensus is looking for a healthy revenue jump of 30% which may catapult the shares higher. Moreover, for the full year, Zacks says analysts are expecting earnings of $0.33 per share with revenue of $1.28 billion which are 153.85% and 31.36%, respectively, above last year’s numbers,
Now let’s check NET’S ranking in VectorVest’s various business categories. It is ranked #12 in the Software Security industry grouping among 50 companies, as well as ranked #103 in the 462-stock broader Software sector, both rankings right around the bottom of the first quintile – nothing to write home about. NET is certainly not a top performer in those two categories.
NET Has Mostly Inferior VectorVest Scores, Is Way Overvalued, But Has A Positive Relative Timing, Earnings, and Sales Trend
VectorVest’s mostly below-average metrics for NET is as follows:
- Poor Upside Potential: The Relative Value (RV) rating focuses on a stock’s long-term, three-year price appreciation potential. The current RV rating for NET is 0.77 which is significantly below average on a scale of 0.00-2.00. The current stock price is $66.93, while VectorVest places its value at $8.03, so it is extremely overvalued by 88%.
- Poor Safety: The Relative Safety (RS) rating is based on the company’s business longevity, financial predictability/consistency, debt-to-equity ratio, and additional risk parameters, including price volatility. Its RS rating of 0.73 is well below average, indicating above-average risk, which makes this stock unsuitable for conservative investors.
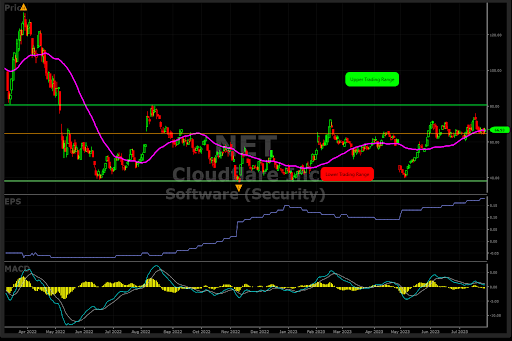
- Excellent Timing: The Relative Timing (RT) rating focuses on the price trend over the short, medium, and long term. The components include price direction, dynamics, and price magnitude of price changes over daily, weekly, quarterly, and yearly comparisons. NET has a high RT rating of 1.28 compared to the average of 1.04 for all the stocks in the database which means that the stock has been an above-average superior performer over multiple timeframes. This is only one of two excellent ratings. The stock price experienced extreme volatility between October 2021 and May 2022, but has settled into a trading range of $39 to $71 since May 2022. NET’s RT has increased significantly from 0.10 in June 2022 to its current 1.46 demonstrating a strong price performance.
- Poor Comfort Index: This index measures the consistency of a stock’s long-term resistance to severe and lengthy corrections. This index compares the individual stock to the fluctuation of the VectorVest Composite price measured on a scale of 0 to 2.00. At a level of 0.76, NET’s rating is well below average. Thus, this stock is only suited for aggressive investors with a high-risk tolerance.
- Excellent Earnings Growth Rate (GRT): NET’s current sales growth over the last 12 months is 37%, with an accompanying positive 42% forward-looking growth rate which is both exceptionally strong and impressive. The latter is measured over a forecasted three-year period. As these important fundamental factors are captured in the software, you can quickly get a picture of the company’s challenging and troubling financials.
- Fair VST Score: The VST Master Indicator ranks 9,141 stocks from high to low and brings stocks with the highest VST scores to the top of the list. NET’s VST is 0.98, right around the average. Using VST enables subscribers to identify stocks that are performing much better or worse than average, and NET is clearly not a winner based solely on this important metric.
To sum up, the metrics reviewed above provide a mixed picture with two poor and one fair rating for its current overvalued price, safety, Comfort Index, and VST scores. The weak RS and RV ratings have both weighed negatively on the VST value, keeping it at a mediocre level of 1.07. Unquestionably, NET has had strong recent price performance as measured by RT, but the ride has been fraught with altitude sickness, first tripling from $66 in May 2021 to $222 in November 221, then crashing 82%to $40 in June 2022. Since then, it has been treading water, closing at $67.05 on July 28, 2023.
If you have an interest in purchasing Cloudflare as speculation, now is not the time to jump aboard, as it is hovering just above its 40-DMA and the MACD is negative. However, with a possible positive earnings release this week, it may work its way higher. A move above $79 is needed to indicate it has broken out of its horizontal 13-month trading range (see chart). If you don’t currently subscribe to VectorVest now is a good time to take a 30-day trial to see its incredible power in identifying the top-ranked stocks within a given sector or the market as a whole, and of course to see the latest ratings on NET on August 4, the day after the earnings release.


Want These Types of Insights at Your Fingertips so You Can Win More Trades?
Use VectorVest to Analyze any stock free. VectorVest is the only stock analysis tool and portfolio management system that analyzes, ranks and graphs over 18,000 stocks each day for value, safety, and timing and gives a clear buy, sell or hold rating on every stock, every day.
Before you invest, check VectorVest! Click here to ANALYZE ANY STOCK FREE and see our system in action!


Leave A Comment