
Elevance Health, Inc., (ELV:NYSE), founded in 1944 is based in Indianapolis. It is a health benefits provider that supports health at each life stage, providing health plans and clinical, behavioral, pharmacy, and complex-care solutions that promote members’ whole health. The company was formerly known as Anthem, Inc. and changed its name to Elevance Health, Inc. in June 2022. Member growth has been 17% from 2018 through 2022. Among the various health-related services the company offers are palliative care, advanced primary care, virtual support, advanced home delivery, crisis support, specialty pharmacy, analytics, and substance use disorder services. The company employs 102,300 full-timers.
Its health benefit brands include Anthem and WellPoint, and its healthcare services brand is CarelonRX. ELV has 47.5 million Blue Cross members which is the highest of any of its competitors including UNH, CVS ad Humana, among others. The company was listed in Fortune magazine’s 2023 ranking of “100 Best Companies to Work For®” Its virtual-only annual meeting is on May 10, 2023. For the year ending in 2022, adjusted EPS growth was 16% CAGR for the past four years, and operating revenue growth was 14% CAGR for the same period. The current market cap is $109 billion.
ELV has a low P/E ratio of 14.8, well below that of average VectorVest stock at 47.05. Moreover, it has forecasted earnings per share of $32.68 for the year ahead. The average daily trading volume of over 1 million shares is more than sufficient for obtaining favorable trade executions. Currently, 2123 institutions hold 93% of the shares, with both Blackrock Inc. and The Vanguard Group holding 9% each. The company currently pays a dividend of $5.92 per share or a yield of 1.22%, about in line with the average VectorVest stock..
VectorVest ranks ELV #3 in its universe of 8 Health HMO Retail Computer stocks, as well as #5 out of 529 stocks in the general Healthcare Business sector. That is a solid accomplishment. These high rankings are understandable with a convincing 20% sales growth over the past year, and its solid historical earnings growth. One negative to consider is that the Health sector is ranked 37 out of 40 based on Relative Timing (RT), but that doesn’t mean individual stocks in that sector will not be able to rise based on their individual characteristics.
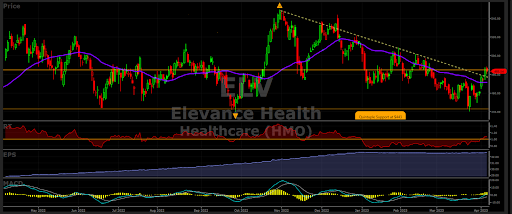
The stock had a solid run from its low on December 3, 2021, at $392.40 to its current price of $483.54 on April 6 with a gain of 23.2%, while the S&P 500 Index by comparison declined 9.75% during this same time period. Its price has been above its 40-day moving average for the last four days, after being below it for a month. Moreover, in the past two days, the downward-sloping dotted trend line since November 2022 has just been penetrated to the upside. Two additional positive developments were the RT breaking above 1.0 and the MACD crossing to the upside in the past few days. This trifecta setup is occurring at the same time and looks ripe for an accelerated nice move much higher, as the earnings growth continues over time..
ELV is Undervalued with Average VectorVest Scores But has Bounced Off a Quadruple bottom
Consider VectorVest’s specific evaluation of ELV’s key metrics:
- Very Good Upside Potential: The Relative Value (RV) rating focuses on a stock’s long-term, three-year price appreciation potential. The current RV rating for ELV is 1.33 which is higher than the average on a scale of 0.00-2.00. VectorVest’s current value of this stock is $574.42 which is significantly higher than its current price of $481.45; therefore it is much undervalued with an excellent opportunity to capture its previous high.
- Good Safety: The Relative Safety (RS) rating is based on the company’s business longevity, financial predictability/consistency, debt-to-equity ratio, and additional risk parameters, including price volatility. Its RS rating of 1.24 is just above average, indicating limited below-average risk.
- Fair Timing: The Relative Timing (RT) rating focuses on the price trend over the short, medium, and long term. The components include price direction, dynamics, and price magnitude of price changes over daily, weekly, quarterly, and yearly comparisons. ELV has a significantly high RT rating of only 1.11 compared to the average 0.85 RT of all the stocks in the database. Interestingly, the chart’s MACD indicator has been at a downtrend since March 9 as the price was in a tight flat trading range, but will likely cross to the upside this week if the stock rallies.
- Poor Comfort Index: This index measures the consistency of a stock’s long-term resistance to severe and lengthy corrections. This index compares the individual stock to the fluctuation of the VectorVest Composite price that is measured on a scale of 0 to 2.00. At a level of 0.55, ELV’s rating is significantly below average. Therefore, this stock is suitable for aggressive risk-oriented investors, and certainly not for conservative investors.
- Very Good Growth Rate (GRT): ELV’s respectable 15% forecasted growth rate is measured over a forecasted three-year period. This fundamental factor is calculated in the VectorVest software, so you don’t have to do the work. The chart below highlights the positive trending earnings.
- Good VST Score: The VST Master Indicator ranks 9,132 stocks from high to low and brings to the top of the rankings those stocks with the highest VST scores. ELV’s above-average score is 1.22 Using VST enables users to identify stocks that are performing much better than average, as well as the opportunity to find the cream of the crop in all its critical criteria with a few mouse clicks. This stock is not yet in that category but could get there going forward after its recent price breakout.
Considering the mixed VectorVest scores, its positive earnings picture and recent price performance, this would be a good time to place ELV on your watchlist. Clearly a price advance to $500 would indicate that the trend is moving in the right direction. The stock may not move in a straight line but a continued uptrend would be a harbinger of a possible run towards its October 2022 high. The company conference call and webcast to review the First Quarter 2023 results will occur on April 19, so listen in if you are considering this stock for purchase.
Before you do anything, make sure that you check out VectorVest’s overall market timing signal to make sure the trend is your friend and sloping upward. And of course determine whether VectorVest ranks this stock a buy, sell or hold recommendation before making a purchase. To see ELV’s current recommendation analyze it free using VectorVest.


Want These Types of Insights at Your Fingertips so You Can Win More Trades?
Use VectorVest to Analyze any stock free. VectorVest is the only stock analysis tool and portfolio management system that analyzes, ranks and graphs over 18,000 stocks each day for value, safety, and timing and gives a clear buy, sell or hold rating on every stock, every day.
Before you invest, check VectorVest! Click here to ANALYZE ANY STOCK FREE and see our system in action!


Leave A Comment