
By Leslie N. Masonson, MBA
ServiceNow (NOW), a NYSE-listed company, became public in 2004 in Santa Clara, California, where it is currently headquartered. It has $8.5 billion in annual sales and a market capitalization of $124.4 billion. ServiceNow added more than 2000 workers over the past year and projects sales growth of over 20% a year going forward.
NOW is not a well-known name to most investors, as it operates in the esoteric enterprise cloud computing software arena. Other services offered include automated workflows, information technology design, and has incorporated Artificial Intelligence, robotics and machine learning into its product line.
The current Chairman and Chief Executive Officer, William McDermott, age 62, announced this past week that he plans to remain at the company until 2030. And that is a good thing, since under his leadership annual revenue has grown since his arrival in 2019 revenue from $3.2 billion to a projected $9 billion by year-end 2023, quite an admiral and impressive performance. Moreover, McDermott had a tremendous track record as head of German software giant SAP SE in his prior position where his tenure was seventeen years in various positions.
McDermott was interviewed last week in “The David Rubenstein Show” on Bloomberg Television, with repeat episodes playing over the next several weeks. I watched this interview and was so impressed with McDermott’s management style and performance at SAP and ServiceNow that I decided to write this article. I highly recommend watching this replay, if you have any interest in the company or the technology revolution.
ServiceNow is in the VectorVest Software Business sector and is ranked #1 out of 297 companies. Moreover, NOW is also ranked #1 in the broader Software sector out of 463 stocks. That sector contains such well-known components as Salesforce.com, Palo Alto Network, Adobe, Microsoft and Workday. The Software sector is comprised of six categories (financial, education, security, business, healthcare, and desktop). The business sector is ranked 192 out of 222, definitely in the lower 15% of the rankings. Even so, NOW has outpaced their competitors and has a solid financial footing going forward. A strong company in a lower ranked group is even more impressive as it is hard for a company to swim against the tide of most companies in its industry.
You can get a clue as to the quality and long-term value of any company based on the number of institutional holders of their shares outstanding. And in NOW’s case, it is massive with 2,054 institutions holding 92% of all shares. Among the top holders of the stock are Vanguard with 17.5 million shares or 8.6%; Blackrock Inc. with 15 million shares at 7.35%; Price (T.Rowe) Associates Inc. at 10.3 million shares or 5%;,and State Street with 8.2 million shares or 4%. Surprisingly, insiders own only 0.23% of the outstanding shares which is a pittance.
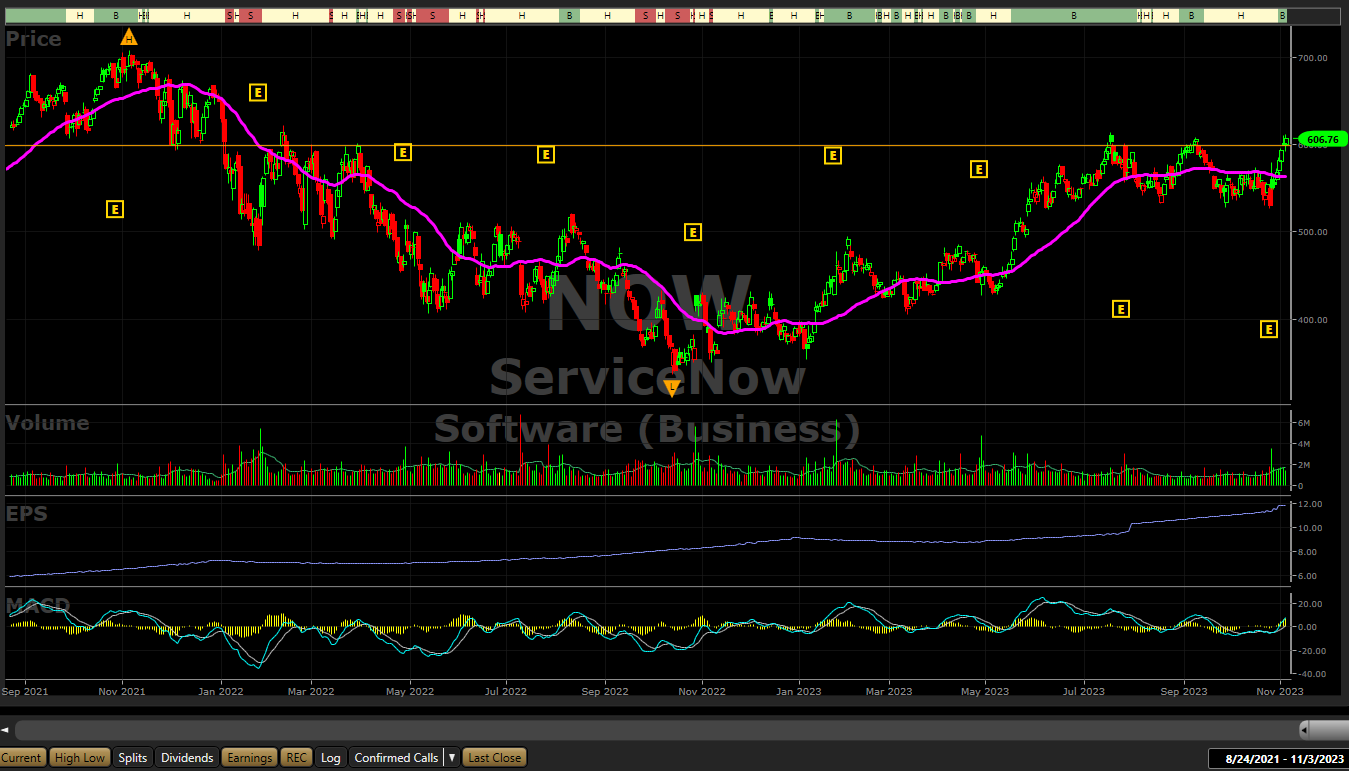
ServiceNow’s stock had a terrific week ending November 3, ending up $7.33 or 1.22% on Friday, and gaining a whopping $52.75 or 9.52% for the week, as the market bounded higher after falling about 10% from early August with a bumpy trend lower. This past week the market reversed direction and accelerated higher five days in a row. Both the S&P 500 and the Nasdaq Composite bounded higher with gains of 5.9% and 6.61%, respectively, after three months of a roller coaster ride down until the upswing this past week.
ServiceNow’s Solid Metrics and Recent Price Recovery Bode Well Going Forward, But Beware of its Excessive Overvaluation
The VectorVest software issues buy, sell, or hold recommendations on 9,154 stocks/ETFs. This proprietary stock rating system splits the data into three simple ratings: relative value (RV), relative safety (RS), and relative timing (RT). Each is measured on a scale of 0.00-2.00, with 1.00 being the average for quick and easy interpretation, and 2.00 being the best.
The VectorVest ratings of NOW are as follows:
- Excellent Upside Potential: The Relative Value (RV) rating focuses on a stock’s long-term, three-year price appreciation potential. The current RV rating for NOW is 1.41 which is well above average. Nevertheless, VectorVest determined NOW to be significantly overvalued with a calculated value of $291.43, about 50% lower than its current price of $606.73. This should be a cautionary note, especially to conservative investors.
- Excellent Safety: The Relative Safety (RS) rating is based on the company’s business longevity, financial predictability/consistency, debt-to-equity ratio, and additional risk parameters, including price volatility. Its RS rating of 1.43 is well above average, indicating minimal risk. Therefore, this stock could be considered suitable for all long-term conservative investors.
- Good Timing: The Relative Timing (RT) rating focuses on the price trend over the short, medium, and long term. The components include price direction, dynamics, and price magnitude of price changes over daily, weekly, quarterly, and yearly comparisons. NOW has an above average RT rating of 1.09 compared to the average 0.92 RT of all the stocks in the database.
- Very Good Comfort Index: This index measures the consistency of a stock’s long-term resistance to severe and lengthy corrections. This index compares the individual stock to the fluctuation of the VectorVest Composite price. With a CI rating of 1.35, NOW is well above average of all rated stocks. Therefore, this stock is suitable for all long-term conservative investors.
- Excellent Growth Rate (GRT): NOW’s 31% forecasted growth rate is exceptional and is measured over a forecasted three-year period. Its sales growth of 25% per year is well above average. This fundamental factor is calculated in the VectorVest software, so you don’t have to do the work. A 5-year chart would show the up-trending earnings with an accelerating move higher after January 2020.
- Very Good VST Score: The VST Master Indicator ranks 9,154 stocks from high to low and brings to the top of the rankings those stocks with the highest VST scores. NOW’s exceptional score is 1.30 which is the upper 1% of the entire database, quite an accomplishment. Using VST enables users to determine stocks that are performing much better than average, as well as the opportunity to find the cream of the crop in all its critical criteria with a few mouse clicks.
ServiceNow is now at a critical quintuple top price level slightly above $600 per share. The price is solidly above its 40-dma while the MACD turned positive this past week. The average daily volume of 1.1 million is certainly sufficient for traders looking for tight bid-to-ask spreads. Interestingly, its Beta of 1.0 equals that of the S&P 500 Index which means that it is no more volatile than the index.
With a very good earnings report in October , and a multi-year positive EPS trend, this stock looks like a long-term winner. VectorVest just rated it a “BUY” as of October 31. The November 4, 2021 all-time high of $707.60 is the ultimate intermediate term target, while the July 19, 2023 intra-day high of $614.36 is the near-term target. Considering the stock’s powerful advance last week, coupled with very good/excellent ratings this stock should be placed on investors’ watchlists looking for a possible pullback for a potential purchase should it slip back to $563 (40-dma line).
Check out VectorVest’s future ratings on this stock before making any move. To see the NOW you can analyze NOW free using VectorVest to get the recommendation.


Want These Types of Insights at Your Fingertips so You Can Win More Trades?
Use VectorVest to analyze any stock free. VectorVest is the only stock analysis tool and portfolio management system that analyzes, ranks and graphs over 18,000 stocks each day for value, safety, and timing and gives a clear buy, sell or hold rating on every stock, every day.
Before you invest, check VectorVest! Click here to ANALYZE ANY STOCK FREE and see our system in action!


Leave A Comment