
By Leslie N. Masonson, MBA
Stride Inc. (NYSE:LRN), a technology-based education services company was incorporated in 2000 in Reston, Va. where it is currently headquartered. The company was formerly known as K12 Inc., but changed its name to Stride, Inc. in December 2020. It has $1.89 billion in annual sales and a market capitalization of $2.46 billion. The Company operates in 50 states and over 100 countries with its roster of 7,8,00 full-time employees.
In its educational speciality space, Stride Inc. may not be as well-known a name to most investors, as are companies as New Oriental Education, Copart, and Fiserv Inc., but it has surpassed them in its #1 ranking in both VectorVest’s Business Service Schools industry (out of 30 stocks), and more broader Business Services Sector (280 stocks).
This sector contains eight industry components and the Business Services industry ranks 72nd out of 222 industries tracked which is in the top-third of that category. Therefore, LRN not only has outpaced its competitors with solid earnings growth going forward, but also a highly ranked VST stock (ranked 16th out of 9,139) in the mid- ranked group is even more impressive.
Currently, 338 institutions hold 102% of their shares outstanding. Among the top holders are Vanguard with 19% of the shares, Blackrock Inc. with 12.3%, followed by Dimensional Fund Advisors with 8.9%, and Morgan Stanley with 4%.
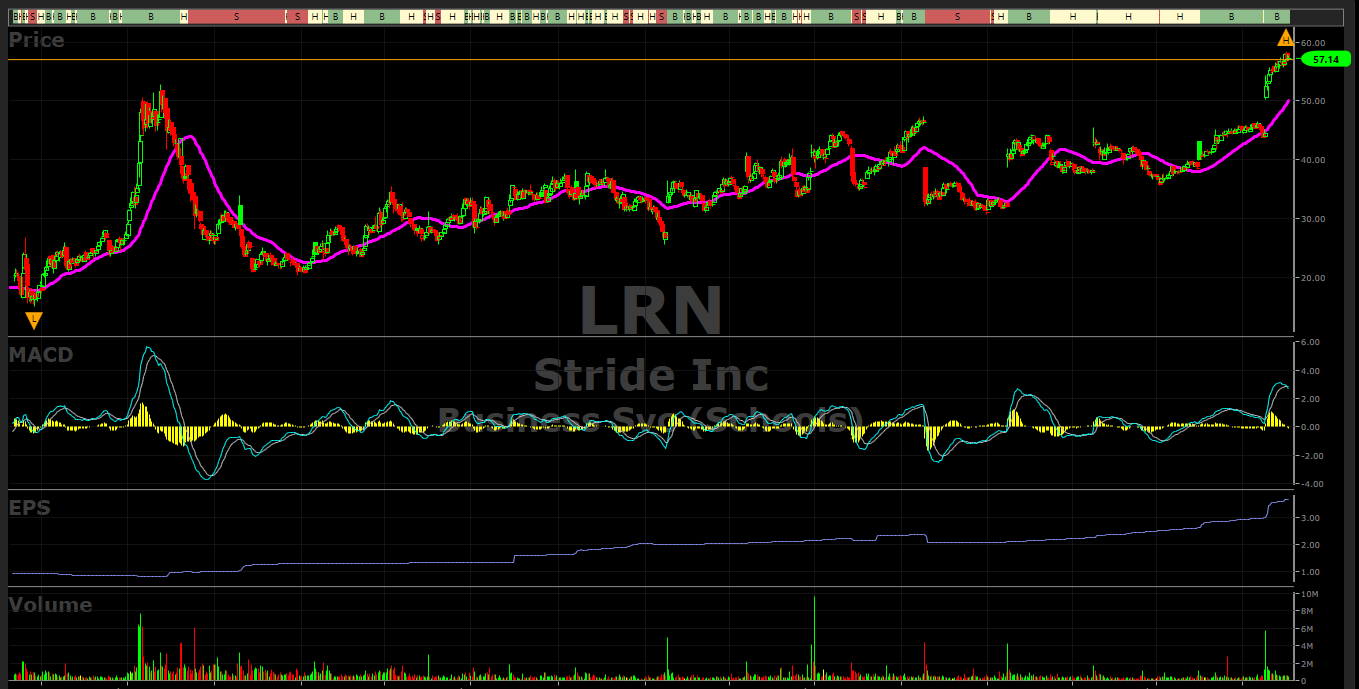
LRN reached its previous high on August 5, 2020 at $52.84 (see the chart below) and then cascaded straight down to $21 before stabilizing and beginning its ascent to its all-time high on November 15, this past week, at $58.39. After being in an 11-point trading range from June 2022 to October 2023, it finally skyrocketed higher on massive volume of 5.8 million shares (more than 9X its average daily volume), after its latest positive earnings report on October 25.
One cautionary factor is that the MACD has just crossed to the downside. This needs to reverse higher before any purchase should be considered. However, on a positive note, its price is well above its 40-dma.The RSI (14) reading (not shown on the graph) is at 72.8, a strong level, but a bit overbought.
Stride Inc.’s Solid Metrics, Recent New High, and Undervaluation Are Positive Signals Going Forward
The VectorVest software issues buy, sell, or hold recommendations on 9,139 stocks. This proprietary stock rating system splits the data into three simple ratings: relative value (RV), relative safety (RS), and relative timing (RT). Each is measured on a scale of 0.00-2.00, with 1.00 being the average for quick and easy interpretation, and 2.00 being the best.
The VectorVest ratings for LRN are as follows:
- Excellent Upside Potential: The Relative Value (RV) rating focuses on a stock’s long-term, three-year price appreciation potential. The current RV rating for LRN is 1.41 which is well above average. Moreover, VectorVest determined LRN to be undervalued with a calculated value of $70.72 about 23.7% higher than its current price of $57.14.
- Good Safety: The Relative Safety (RS) rating is based on the company’s business longevity, financial predictability/consistency, debt-to-equity ratio, and additional risk parameters, including price volatility. Its RS rating of 1.24 is above average, indicating less than average risk. Therefore, this stock can be considered by long-term conservative investors.
- Excellent Timing: The Relative Timing (RT) rating focuses on the price trend over the short, medium, and long term. The components include price direction, dynamics, and price magnitude of price changes over daily, weekly, quarterly, and yearly comparisons. LRN has an exceedingly high RT rating of 1.56 compared to the average 0.96 RT of all the stocks in the database.
- Very Good Comfort Index: This index measures the consistency of a stock’s long-term resistance to severe and lengthy corrections. This index compares the individual stock to the fluctuation of the VectorVest Composite price. With a CI rating of 1.28, LRN rating is much better than average. Therefore, this is another positive metric for all long-term conservative investors.
- Very Good Growth Rate (GRT): LRN’s 19% forecasted growth rate is exceptional and is measured over a forecasted three-year period. Its sales growth of 13% per year is good. These fundamental factors are calculated in the VectorVest software, so you don’t have to do the work.
- Excellent VST Score: The VST Master Indicator ranks 9,139 stocks from high to low and brings to the top of the rankings those stocks with the highest VST scores. LRN’s score is 1.42 which is the upper 0.2% of the entire database, quite an outstanding accomplishment. Using VST enables users to determine stocks that are performing much better than average, as well as the opportunity to find the cream of the crop with a few mouse clicks. LRN certainly falls into that category.
With a multi-year positive EPS trend (39% average annual earnings growth over the past five years), this stock has all of the key characteristics of a long-term winner. Moreover, its low Beta of 0.32 (which means it is only one-third as volatile as the S&P 500 Index) is a big plus for most investors with a low risk tolerance. The average daily volume of 691,000 shares is certainly sufficient for traders looking for tight bid-to-ask spreads.
VectorVest rates LRN as a “Buy” since August 17. Considering the stock’s powerful year-to-date advance, coupled with increasing earnings, this stock should be placed on investors’ watchlists. Look for a possible entry if the stock exceeds its recent high of $58.39. A price drop below $55.62 would warrant further evaluation to determine if the trend has reversed to the downside.
You can easily check out VectorVest’s future ratings on this stock before making any move. Analyze LRN free using VectorVest to determine the current recommendation which can change at any time based on market conditions.


Want These Types of Insights at Your Fingertips so You Can Win More Trades?
Use VectorVest to analyze any stock free. VectorVest is the only stock analysis tool and portfolio management system that analyzes, ranks and graphs over 18,000 stocks each day for value, safety, and timing and gives a clear buy, sell or hold rating on every stock, every day.
Before you invest, check VectorVest! Click here to ANALYZE ANY STOCK FREE and see our system in action!


Leave A Comment