
by Leslie N. Masonson, MBA
TriNet Group, Inc. (NYSE:TNET), was incorporated in 1988 in Dublin, CA where it is currently headquartered. It has $4.9 billion in annual sales and a market capitalization of $6 billion with 339,341 full-time employees.
The company provides comprehensive human resource solutions and consulting services to small and mid-sized businesses, multi-state payroll processing services, tax preparation and administration, as well as employment risk mitigation choices. Moreover, their offerings include employee benefits programs such as health insurance and retirement plans.
On December 21 the company was recognized as one of America’s Greatest Workplaces for Diversity by Newsweek, earning 5-stars on a mid-sized company list. Previously, on December 19, the company announced a redesigned website combining many HR capabilities at www.trinet.com.
For its size and unique product lines, the company is popular among institutions as 362 hold 98.9% of their 50 million shares outstanding. The top three institutional players all hold shares including Vanguard Group Inc. with 12.3%, BlackRock Inc. with 5.3%, and Wellington Management Group with 5.2%. This considerable interest by large institutions is a big plus as those are the type of firms that can push the stock price higher as they buy more shares for their clients, mutual funds or ETFs. Currently, six analysts cover the company.
TNET Inc. is probably not a well-known name to investors, which is common for mid-sized non-sexy companies, nevertheless TNET has landed at the #4 ranking in VectorVest’s Business Services (Misc.) business sector out of 125 companies as well as #9 in the broader Business Services sector of 278 companies. Moreover, the business sector is ranked 107 out of 222 industry sectors tracked by VectorVest, which is in the middle of the pack. So, the stock is outperforming its competitors by a wide margin.
TNET’s Strong Metric Ratings, Significant Undervaluation, and Growing Earnings Portend a Bright Future
The VectorVest software issues buy, sell, or hold recommendations on 9,125 stocks. This proprietary stock rating system splits the data into three simple ratings: relative value (RV), relative safety (RS), and relative timing (RT). Each is measured on a scale of 0.00-2.00, with 1.00 being the average for quick and easy interpretation, and 2.00 being the best.
The VectorVest ratings for TNET are as follows:
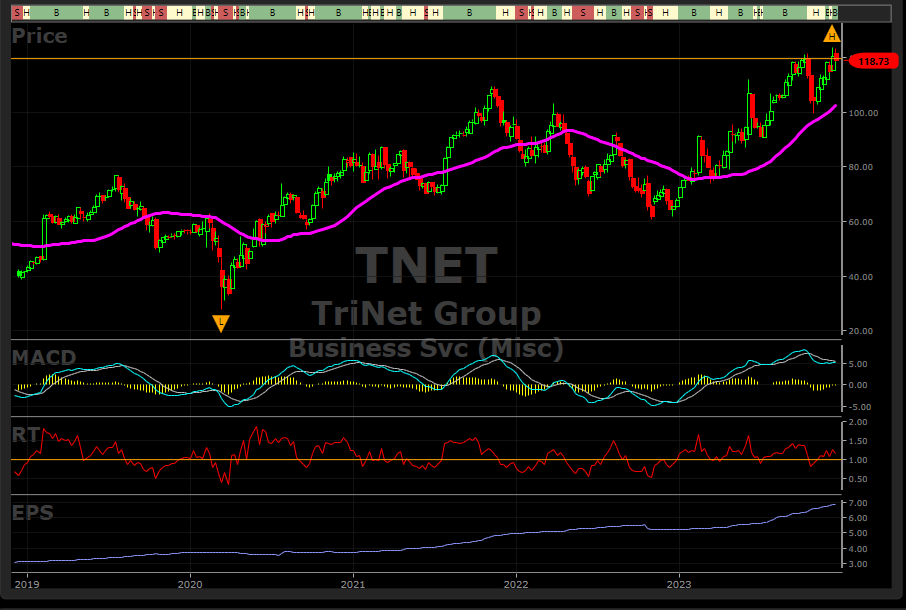
- Excellent Upside Potential: The Relative Value (RV) rating focuses on a stock’s long-term, three-year price appreciation potential. The current RV rating for TNET is 1.42, which is exceptionally high. Moreover, VectorVest determined that TNET is significantly undervalued with a calculated value of $163.27. Therefore, the stock can move another 37.5% before reaching the value placed on it from its current price of $118.73.
- Excellent Safety: The Relative Safety (RS) rating is based on the company’s business longevity, financial predictability/consistency, debt-to-equity ratio, and additional risk parameters, including price volatility. Its RS rating of 1.41 is well above average, indicating below average risk. Therefore, long-term conservative investors should be comfortable holding this stock.
- Good Timing: The Relative Timing (RT) rating focuses on the price trend over the short, medium, and long term. The components include price direction, dynamics, and price magnitude of price changes over daily, weekly, quarterly, and yearly comparisons. TNET has a slightly above average RT rating of 1.18 compared to the average 1.11 RT of all the stocks in the database.
- Excellent Comfort Index: This index measures the consistency of a stock’s long-term resistance to severe and lengthy corrections. This index compares the individual stock to the fluctuation of the VectorVest Composite price. With a CI rating of 1.63, TNET rating is exceedingly high. Therefore, this is another positive metric indicating that it is suitable for long-term conservative investors.
- Good Earnings Growth Rate (GRT): TNET has annual sales of $4.9 billion and a 14% forecasted growth rate. Unfortunately, its sales growth of -2.0% over the last year is very disappointing. These are just a few of the important fundamentals that are calculated in the VectorVest software and available with a mouse click.
- Very Good VST Score: The VST Master Indicator ranks 9,125 stocks from high to low and brings to the top of the rankings those stocks with the highest VST scores. TNET’s score is 1.33 which is above average. Using VST enables users to determine stocks that are performing much better than average, as well as the opportunity to find the cream of the crop with a few mouse clicks. TNET is not at the top of the VST scoreboard, but it is certainly in the top 1% of companies reviewed.
Overall, TNET is a solid company with many positive attributes as spelled out above. It also has a positive MACD (see graph below), and has been in a smooth uptrend since November 1, making an all-time high of $123.67 on December 14. Generally speaking, strong acting stocks making all-time highs tend to move much higher if earnings pace continue to rise.
The current stock price is only 5.4% above its 40-day moving average, which is certainly not an issue, and the RSI (14) that is not shown on the chart is at a reasonable 56. That is considered mid-range with nothing to be concerned about. Any price decline below $114.61, its last swing low, and especially $112.88 (40-dma) would indicate there is more downside, and any investors should stay away at that point until it reverses and receives a VectorVest ‘Buy” signal.


Want These Types of Insights at Your Fingertips so You Can Win More Trades?
Use VectorVest to analyze any stock free. VectorVest is the only stock analysis tool and portfolio management system that analyzes, ranks and graphs over 18,000 stocks each day for value, safety, and timing and gives a clear buy, sell or hold rating on every stock, every day.
Before you invest, check VectorVest! Click here to ANALYZE ANY STOCK FREE and see our system in action!


Leave A Comment