If you’re looking for advice on how to time the market, you’ll likely come across more resources advising you against trying to implement this tactic into your strategy than resources showing you how to do it.
The concept of timing the markets is hotly debated. Some say it’s impossible – but the truth is, you can time your trades to perfection by leveraging the VectorVest software. And in this guide, we’ll show you exactly how it works.
You’ll learn about the basic technical indicators used in traditional market timing strategies, and we’ll also help you put your strategy on autopilot with our suite of intuitive tools. With our market timing indicators, you can win more trades with less work.
By the time you finish reading this resource, you’ll be well-equipped to implement this strategy yourself. And as a result, you’ll earn more consistent profits and protect your portfolio from unnecessary downside exposure.
That being said, let’s first explain the concept of market timing itself.
What is Market Timing?
First things first – what is market timing strategy?
If you’re new to this concept, it’s the strategy of making buy or sell decisions of financial assets, often stocks, by attempting to predict future market price movements. The prediction may be based on an outlook of market or economic conditions resulting from technical or fundamental analysis.
This strategy stands in contrast to buy-and-hold and dollar cost averaging investing strategies where you invest a fixed amount in a specific investment at regular intervals over time regardless of the price or direction of the market.
We’ll explain why you’d want to go to the extra work of timing the market in a moment. First, though, we need to prove whether or not this is even possible in the first place.
Can You Really Learn How to Time the Market?
Now…as you may already have discovered, the concept of market timing is very controversial – because those who oppose it are just as strong in their stance as those in favor.
That being said, let’s unpack this debate to help you determine if it’s worth learning how to time the stock market in the first place.
The Debate Around Market Timing
The investing world is divided on the topic of market timing. On one hand, some experts argue that market timing is an exercise in futility.
Their perspective is grounded in the efficient market hypothesis, which suggests that at any given time, stock prices fully reflect all available information and instantly adjust to new information. Thus, they believe it’s impossible to ‘outsmart’ the market on a consistent basis.
On the other hand, there are proponents who believe in the potential effectiveness of market timing, asserting that careful analysis and judicious decision-making can indeed yield fruitful results.
These proponents often reference periods of significant financial downturn, like the Dot Com Bubble or the great financial crisis of 2008, as instances where astute market timing could have helped investors avoid significant losses.
They also point out the obvious holes in the efficient market hypothesis. The fact of the matter is that not all participants have access to the same information. Most individuals are late to the party by the time they’re privy to key information.
A Look at Past Market Trends and Cycles
Understanding past market trends and cycles can provide invaluable insights when it comes to timing the market. This doesn’t mean predicting the future based on the past, but instead recognizing potential signs of market turning points and using this knowledge to make informed investment decisions.
VectorVest’s history is a testament to the importance of market trends and cycles. The system has called every major market move for 20 years and counting – from the Dot Com Bubble to the COVID-19 Correction. Over that span, the system has outperformed the S&P 500 index by 10x.
Why Learning to Time the Market Could Be Beneficial
Although market timing comes with its own set of challenges, learning to do it effectively could potentially yield considerable benefits.
These include the opportunity to maximize swing trading profits by buying low and selling high, and the ability to avoid significant losses during market downturns.
In addition, effective market timing can lead to better risk management. By understanding market trends and cycles, investors can adjust their portfolios in response to changing market conditions, thereby managing their risk exposure.
Remember, though, that while the potential rewards are significant, so too are the risks. Successful market timing requires not just knowledge and skill, but also discipline, patience, and a well-defined investment strategy. With the right tools and information, like those provided by VectorVest, learning to time the market can indeed become an achievable goal.
And with that said, let’s get into what you came here for today: to learn how to time the market. In order to do that, we must start with a conversation on the various ways to analyze a stock.
Understanding the Building Blocks of Market Timing: Key Indicators to Aid in Your Strategy
Market timing relies heavily on understanding certain key indicators. These are your roadmap, guiding you through the intricacies of timing the market with precision and success.
So, let’s unveil the most powerful indicators for swing trading, position trading, trend trading, or even day trading – starting with the RT and NPI ratings.
Identifying Market Trends: The Power of the Relative Timing (RT), and Near Perfect Indicator (NPI)
Stan Heller, Managing Director of VectorVest Canada, introduced an instrumental tool in the timing game called the “Near Perfect Indicator” (NPI).
The NPI tracks when a stock’s price is rising or falling by comparing the 5-day moving average of Relative Timing (RT) to the 40-day moving average of RT.
Wait – what is RT? It’s short for relative timing, which is a rating that represents the direction, dynamics, and magnitude of a stock’s price movement. It’s taken day over day, week over week, quarter over quarter, and year over year.
And, it sits on a simple scale of 0.00-2.00, with 1.00 being the average. This allows you to quickly and easily get a sense of what sort of price trend – if any – exists for a stock. Moreover, the RT rating speaks to the strength of that trend.
This analysis helps to accurately identify market trends, playing a significant role in optimizing your buying and selling decisions. With the NPI and RT ratings, timing the market becomes more accessible and less daunting. We’ll talk about how to actually use them to time the market later on.
The Importance of Volume in Timing the Market
Volume, the number of shares or contracts traded in a security or market during a given period, is a critical component of market timing. Significant changes in volume can often signal impending shifts in stock price.
High volume periods are typically associated with market tops and bottoms, as they reflect strong investor sentiment. Conversely, low volume can indicate indecision or uncertainty, leading to price stagnation or less drastic price movements.
Incorporating volume analysis in your market timing strategy helps ensure you’re acting on solid, substantive price movements rather than false alarms.
Market Sentiment and Its Role in Market Timing
Understanding market sentiment is crucial in timing the market effectively. It refers to the overall attitude of investors toward a particular security or financial market. It is often driven by news, economic reports, and global events, which can induce wide-scale changes in the market.
VectorVest’s stock market sentiment indicator measures market sentiment and provides visual representation of price, volume, and sentiment data, helping you gauge the general mood of the market and make informed decisions accordingly.
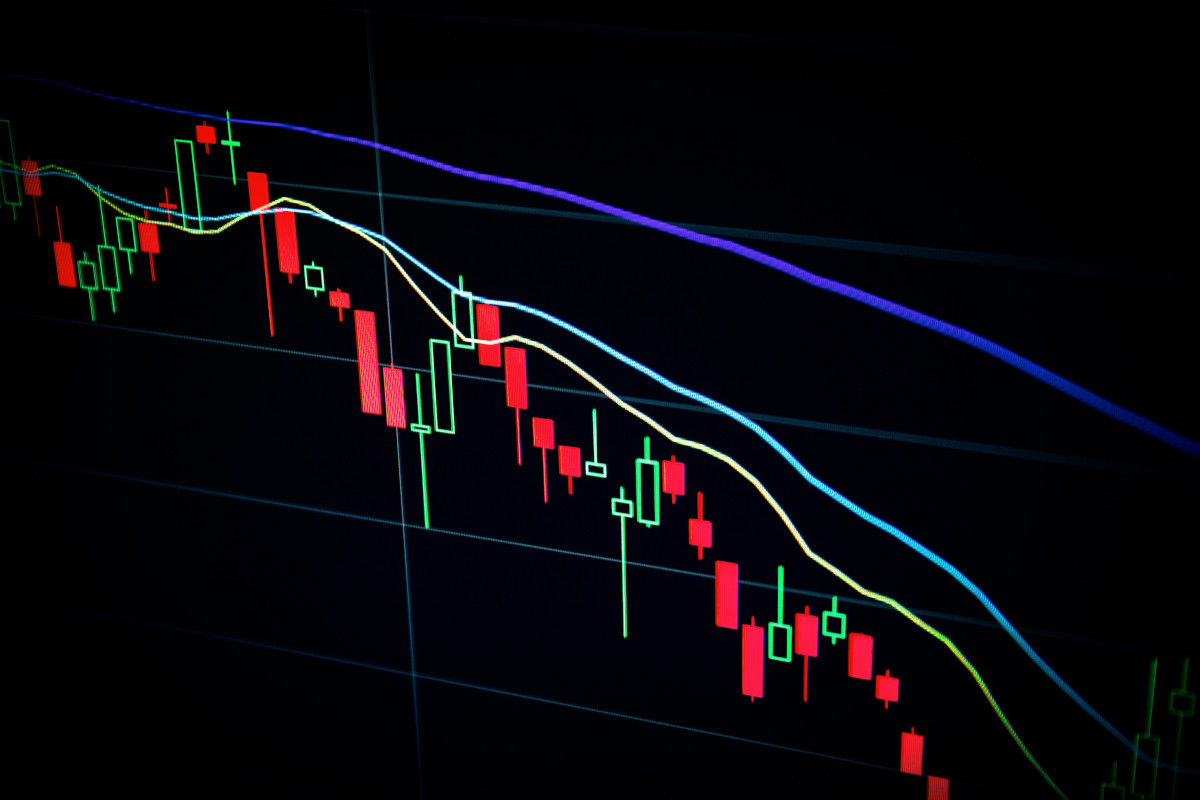
The Magic of Moving Averages: Simplifying Price Behavior Analysis
Moving averages provide a smoothed line of a stock’s price history, removing daily price fluctuations and making it easier to identify price trends. They are especially helpful when you want to determine whether a stock is in an uptrend or downtrend.
For example, if a stock’s price is above its moving average and is moving away from the average, the stock is in an uptrend. Conversely, if the price is below its moving average and moving away from the average, the stock is in a downtrend.
So, how do these tools and indicators all work together to help you time the market? Now that you’re aware of them and their role, let’s actually guide you through how to time the market to perfection with VectorVest.
How to Time the Market to Perfection With VectorVest
Timing your trades well can maximize your profits, while poorly timed trades can erode your capital quickly. Fortunately, using the best swing trading platform – VectorVest – can simplify your market timing strategy to help you maximize the upside while minimizing the downside.
But before we show you how to time the stock market and effortlessly repeat the system on autopilot, we want to talk about what market timing looks like traditionally – without VectorVest. In just a moment, you’ll see why you need it in your suite of tools.
First, Here’s How Market Timing Works Without VectorVest
Traditionally, an investor might spot an opportunity by conducting hours of fundamental analysis. For example, they could analyze a company’s quarterly earnings reports, noting a consistent pattern of revenue growth and improving profit margins. They might also assess the company’s position within its industry and the overall health of the economy.
Once they’ve identified a potential opportunity, they would turn to technical analysis to determine the entry point. They might, for example, observe the stock’s price pattern on a chart, looking for a bullish breakout above resistance or a bounce off support levels as a buy signal.
Let’s say you’ve identified Company A, which is undervalued and shows promising growth potential. You spot a breakout on the price chart and decide to enter the market, buying shares of Company A stock.
Then, it’s a matter of managing your position. You might set a target return level based on your risk tolerance or a stop-loss level to protect their capital. Or, you might continuously monitor news events, earnings reports, and price charts to decide when to sell.
For instance, after entering the market, you might decide to aim for a 10% return before selling. Or, if the stock’s price falls by 5% from your entry point, you would sell to cut their losses.
This is the process for a traditional investor that uses fundamental analysis. These value investors as they’ve come to be known think that any stock that is undervalued will eventually be valued properly – in reality, though, this doesn’t always pan out.
The Challenges & Limitations of Traditional Market Timing Tactics
Both fundamental and technical analysis requires a great deal of time, knowledge, and effort. Keeping up with constant market fluctuations, news events, earnings reports, and economic indicators can be a full-time job.
Moreover, interpreting the data correctly is an art in itself, which comes with experience and skill. Making inaccurate interpretations or missing out on key indicators can lead to significant investment mistakes.
In addition, traditional market timing methods expose investors to a high degree of risk. Since it’s almost impossible to consistently predict the market’s top and bottom, investors run the risk of entering or exiting at suboptimal points.
These are all the points that market timing naysayers bring up in showing why the strategy doesn’t work. And frankly, we agree – if you’re not leveraging a powerful market timing system like VectorVest, you’re going to have a hard time seeing consistent success.
So, let’s take a look at how to time the stock market using our intuitive suite of tools…
How to Time the Market Quickly and Easily With VectorVest: Uncover Opportunities, Find Your Entry, and Time Your Exit
It is ironic that literally everyone on Wall Street says, “you can’t time the market,” but they
all try to predict it. This is not about predicting the market. It’s about timing, i.e., reading
our indicators and letting them tell us when the market is rising or falling. It’s about sensing turning points and knowing when to invest aggressively and when to take defensive actions. We want to buy within five percent of a bottom and sell within five percent of a top. There’s a reason our stock analysis software is considered the best stock analysis app: it helps you win more trades with less work while minimizing human error, emotion, and guesswork from your strategy.
The VectorVest market timing system depends upon two key Indicators:
- The Price of the VectorVest Composite, and
- The VectorVest Buy/Sell Ratio.
Both indicators were developed by VectorVest, which are proprietary to the software and analyzes over 18,000 stocks each day for Value, Safety and Timing and gives a Buy, Sell or Hold recommendation on each stock each day. The Price of the VectorVest Composite, VVC, an arithmetic indexed average of all the stock prices in the database, is the most important indicator used in timing the market. When the Price of the VVC has moved two weeks either up or down, you can bet that the market has moved in the same direction.
The VectorVest Buy/Sell Ratio, BSR, is the second most important indicator used in timing the market. It responds to the directional movement of the Price of the VVC and increases as the market moves higher and decreases as stock prices move lower. This indicator is amazingly sensitive to the inner movements of the market.
When the ratio of Buys to Sells is above 1.00, the market is robust. Correspondingly, the market is weak when the Buy to Sell Ratio is below 1.00. Since VectorVest gives buy ratings to stocks moving higher in price and sell ratings to stocks falling below their Stop Price, we knew from the very beginning that the Buy/Sell Ratio was an excellent indicator for measuring the health of the market.
Here’s how the whole system works:
If the Price of the VVC moved up or down over a five-day trading period, it gave a preliminary signal of the market’s direction, up or down. This signal is called the Primary Wave. If the Primary Wave is followed by another five trading-day move in the same direction, the preliminary signal was reinforced, but not confirmed. This signal is called the Confirmed Call. We must turn to the BSR for confirmation of the market’s direction. A Confirmed Up, C/Up, is given when the Price of the VVC has gone up for two consecutive five trading day periods, closes higher than the previous day and the BSR is above 1.00. A Confirmed Dn, C/Dn, signal is given when the Price of the VVC has gone down for two consecutive five trading day periods, closes lower than the previous day and the BSR is below 1.00.
This encapsulates the market direction as a whole. The timing of individual stocks, although similar in calculation, is slightly different in practice. Despite the difference, it is still incredibly easy to identify the best investment opportunities from a timing perspective.
For identifying individual stock opportunities, VectorVest’s Value, Safety, and Timing (VST) system is crucial. Instead of sifting through financial reports, you can use the VST system, which assigns a value to each stock based on its intrinsic value, its safety relative to price volatility, and its timing potential. Higher VST scores indicate better opportunities.
For example, with VectorVest, you can pull up our list of pre-curated stock screeners on a given day. These bring the best stocks (based on whatever criteria you’ve set) to your screen. Let’s say you identify Company B with a high VST rating above the average of 1.00, indicating a good investment opportunity.
For finding your entry point, VectorVest’s proprietary Relative Timing (RT) indicator is invaluable. RT combines the power of trend, momentum, and velocity of a stock’s price movement into one comprehensive indicator.
A rising RT score (above 1.00) indicates a stock is in an uptrend and is an optimal time to enter. In our case, if Company B shows an RT score above 1.00 and is increasing, it’s time to buy. Conversely, a falling RT rating below the average indicates a negative price trend, and that it’s time to sell.
For exits, VectorVest’s Stop Price feature automatically calculates a stop-loss level for each stock based on its volatility. This removes the guesswork from setting stop losses. If the price of the stock drops below this level, VectorVest sends an alert suggesting it might be time to sell and cut losses.
For instance, VectorVest may set a stop price for Company B. If the price falls below this level, it’s time to sell. Alternatively, if the stock price rises by 10% or more from the entry point (depending on your target return), you could also decide to sell and secure your profit.
The best part? With our ProfitLockerPro product, you can automate when to take profits and cut loss through dynamic trading stops. It helps you remove yourself from the actual process of managing your position, leaving it to a proprietary algorithm that locks in profits when they come and cuts losses before they get too steep.
With VectorVest, the process of market timing becomes straightforward, efficient, and more accessible for all investors. But, we encourage you to see it in action yourself before you decide one way or the other. You can get a stock analysis free today. And with that said, it’s time we bring this guide on how to time the market to a close.
Bringing Our Guide on How to Time the Market to a Close
Hopefully, this guide on how to time the stock market has helped you feel more confident and capable of uncovering opportunities, identifying the right entry point, and getting out as the stock is heading back down, securing solid profits along the way. With VectorVest, it’s possible to consistently time the market and supplement your income or earn a full time living.
Want to learn more about market timing? We have a plethora of resources in our blog, including breakdowns on topics like the best time of day to buy stocks, best day of the week to sell stock, time in the market vs timing the market, how to buy the dip, buying and selling stocks after hours, and more.
Or, you can learn about trading in general – with our guides on swing trading vs day trading, how the stock market works, how to find stocks for swing trading, investing early for retirement, and more.
Otherwise, it’s time to take what you’ve learned in this guide on how to time the market and apply it. We encourage you to start with paper trading, as transitioning to this strategy may require a bit of a learning curve.
But eventually, you’ll find that executing a market timing strategy with VectorVest becomes second nature. You’re able to identify an opportunity, find your entry, and get out with a modest profit consistently. So, get set up with the full dashboard or our stock advisory today and experience a whole new way of trading.


Leave A Comment