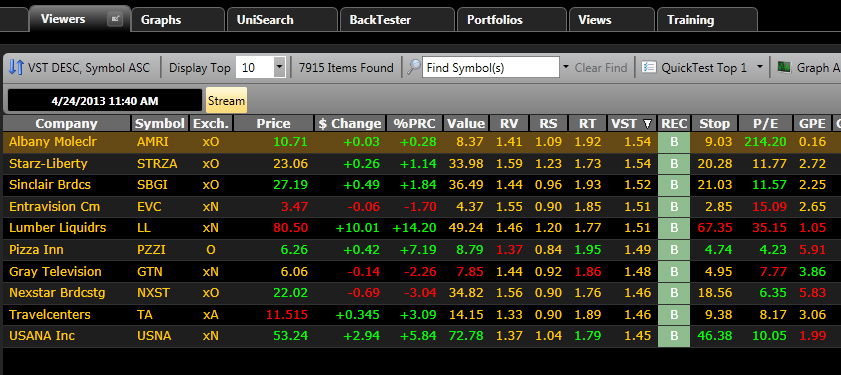
VectorVest’s VST graph and some of the indicators that go into rating stocks.
As a savvy investor, there are three things you should know about stocks:
- What a stock is really worth
- How safe is the stock
- When to Buy, Sell or Hold the stock
How To Determine What a Stock Is Really Worth
Stock analysts have many ways to determine the value of a stock. Naturally, the most common way is by price. However, just because a stock is priced high—or conversely, priced low—doesn’t mean the stock is worth the price. A high priced stock could be trending downward, meaning the price you pay now would stick you with a stock that is losing value. A low priced stock could be trending upward, which would be a great deal! Obviously, price alone is a poor indicator of value.
Another common indicator of stock value is the P/E, or price-to-earnings ratio. By determining what the company in question is actually earning in comparison to the asking price of the stock, the P/E ratio is a far superior indicator of a stock’s true value. Other sophisticated ranking systems include stocks ranked by earnings growth and stocks ranked by G/PE. Now you are starting to get a clearer picture of what is really happening with the company. Are they making money? Do they have costs under control? These are fundamental questions that need to be answered. However, VectorVest offers an even more complex equation for determining stock value:
V=100 x (E/(IY+YP))
x Sqr [((R+G)/2)/((IY+YP)+F)]
where
E = Earnings in $ / share
IY = Interest Rate in %
YP = Yield Premium
R = % Return on Total Capital
G = Earnings Growth in % / yr.
F = Inflation Rate in % / yr.
In case you’re not a math whiz, or haven’t any inclination to compute all these variables, the VectorVest software does it for you. By factoring in all these variables, you get a very sophisticated picture of what a company is really worth.
How to Determine the Safety of a Stock
The VectorVest software program uses Relative Safety, or RS, as an indicator of risk. Consistency and Predictability of Financial Performance are the primary factors in assessing Relative Safety.
Another determining factor is Relative Value, or RV. RV is an indicator of long-term price appreciation potential. Price, Value, Earnings Growth, AAA Corporate Bond Rates and Risk are used to compute Relative Value.
Finally, Relative Timing, or RT, should be factored into the equation. RT is an indicator of short-term trends. The Direction, Magnitude and Dynamics of Price History are used to determine Relative Timing.
The VectorVest application has a master indicator known as VST-Vector (Value, Safety, Timing). VST-Vector combines RV, RS and RT into a single comprehensive indicator. With all these indicators factored into each stock, you are assured of making safer stock picks on a consistent basis.
How to Determine When to Buy, Hold, and Sell Stocks
The VST-Vector, as stated previously, uses RS, RV and RT when determining stock value and safety. These indicators factor when to buy, hold and sell as well. One more indicator, the Stop Price, also comes into play. An adjusted 13-week Moving Average of Closing Prices is used to compute Stop Prices. Essentially, when a stock begins to lose value, you need an exit strategy. No need to lose all your gains! With VectorVest, all factors are considered in making a buy, sell or hold recommendation.
Every day, each of the stocks in the VectorVest Trading System (over 8,300 stocks!) is analyzed by the VST (Value, Safety, and Timing) formulas. Then each stock is scored using an easy-to-understand 0.00-2.00 rating system. Ratings above 1.00 are favorable and ratings below 1.00 are unfavorable. How simple is that?
The VectorVest Buy, Sell or Hold Criteria
Buy
- Price > Stop Price
- VST > 1
- RT > 1
- Price must be diverging away from Stop Price
Sell
Price < Stop Price
Hold
Price > Stop, but any of the other three factors needed to receive a Buy are not met.
VectorVest Helps You Pick Winners Consistently
You can see that a lot goes into making sound decisions for purchasing stocks. VectorVest, while an extremely powerful program, takes the guesswork out of choosing stocks and market timing and helps you to pick winners consistently and easily. You won’t need to go it alone, either. VectorVest offers regular training events and has a support staff ready to help you with any questions you may have. Get started today for a brighter future tomorrow!
Did you enjoy this post? Be sure to share it with friends and colleagues by clicking the share buttons below. If you would like a more in-depth explanation of the principles explained in this article, VectorVest offers the 5 disc Two-Day Investment Seminar video set. It’s like attending a training seminar without traveling! And you can replay in the comfort of your home anytime you need to refresh your memory.


I am a little weary about the possibility of scams, however I may subscribe in the future.
Scott,
You need not worry about VectorVest being a scam. We have been in business for 25 years; we have offices in Ohio and North Carolina; we have passed scrutiny by regulators in the US and abroad; and we operate in 9 different countries! You should try the 5 Week Trial to see for yourself.
I signed up for the 5 week trial, but after logging on to the VectorVest system and submitting my stock symbols to be analyzed, the system states I’m only allowed 3 free stocks to be analyzed at a time. I received 6 stocks analyzed out of the 9 requests I made over a two day period. Am I missing something, or is there a limitation to the number of stocks I can request for analysis at a time?
Hi Ron,
There is no limitation for stock analysis. I would give support a call and have someone walk you through the issue. You can reach technical support at 888-658-7638.
I find you system very impressive! Perhaps an ignorant questions; however, when one has mastered the system and wants to venture into the market utilizing your program with whom will the trades be effectuated by. Would one use your system for the evaluation/selection and then deal with a Broker to make the trades.
I found your Back Testing demonstration most interesting particularly when it shows the cash position and then back in the market etc. as if it is managing all of this for your…I presume that is not the case! I suppose one has to initiate the trades, stops, cash positions etc. based on the input from your program?
Hi Jim,
Your question isn’t ignorant at all! You are correct in your assumption. You would need to find a broker to do the actual trading. The VectorVest system helps you make informed decisions on market timing. The Back Tester is a great tool to see how a strategy works out over time. You can tweak it until you find just the right combination of risk and reward which is just right for you. Once again, the system will tell you when to get in and out, but you will need to actually make the trades. Hope this makes sense. If not, our telephone support is free and the lines are open M-F 24/7 and Sat 9-5. The support staff will be more than happy to help you with any questions you may have.