The VectorVest MTI Makes It Easy to View Underlying Market Trends!
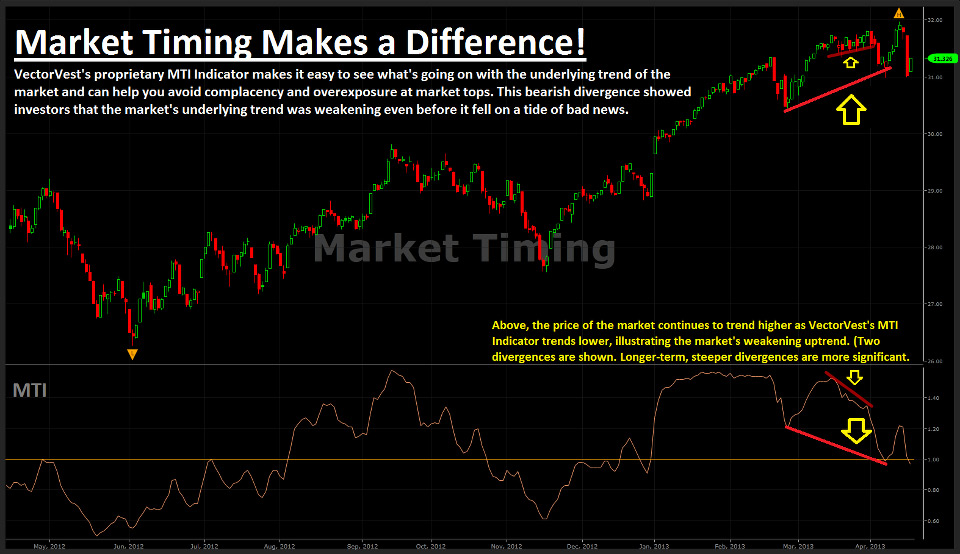
As the graph below indicates, VectorVest’s proprietary MTI (Market Timing Indicator) makes it so easy to see what’s going on with the underlying trend of the market. This helps you avoid complacency and overexposure at market tops.
Notice how VectorVest’s MTI is trending lower, signaling that this market’s uptrend has peaked and it would be a prudent time to exit. The VectorVest software takes the guesswork out of market timing and helps you secure steady profits.
BTW, did you know VectorVest is now on Facebook? Be sure to like us to keep up with upcoming events, specials and so much more! Did you find this information useful? Share with your friends and colleagues by clicking the icons below.


Leave A Comment