
Guilty. I admit it. I’m guilty. What with the UniSearch tool and now the AutoTimer, I’m in search of a killer strategy that makes money no matter what. But isn’t VectorVest supposed to help me do that in the first place?
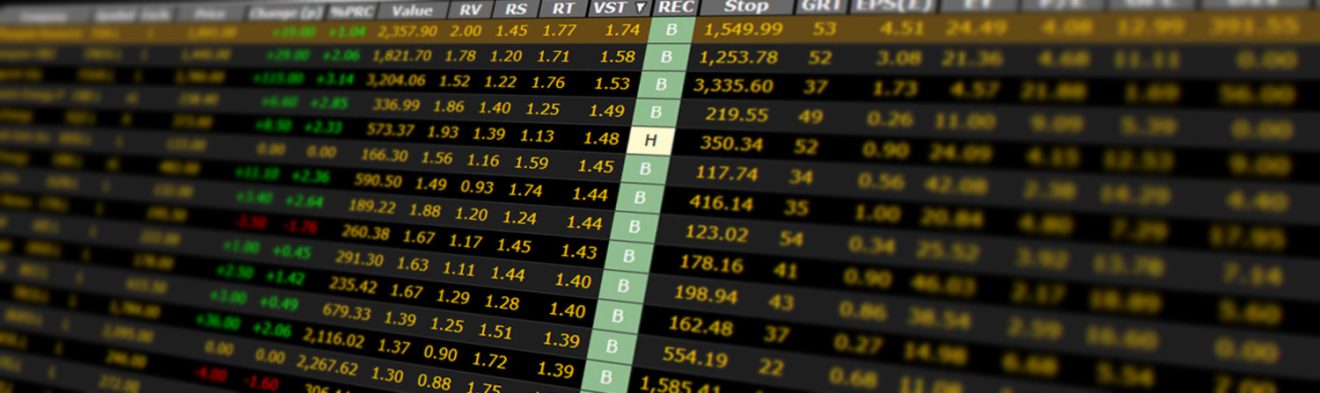
Yes, of course. VectorVest is designed to bring the “best” stocks to your attention with a single click of a mouse. The “best” stocks, according to VectorVest, are those ranked highest by VST-Vector. On any given day, they have the best combination of Value, Safety and Timing of all the stocks in the database. So what could be simpler than clicking on Stock Viewer and looking at the top stocks ranked by VST-Vector?
Sure, I’ve heard it a thousand times before. “I bought some high VST stocks and they all went down.” “High VST stocks have already gone up, aren’t they overbought?” “I want to buy stocks that are just starting to go up, how do I do that?” But the fact remains: Thousands of tests have shown that high VST-Vector stocks tend to go up over time and low VST-Vector stocks tend to go down over time. The odds of picking a stock that is more likely to go up than down are in your favor when you select high VST-Vector stocks. Even so, there are ways of increasing the odds of picking winners and avoiding losers when picking high VST stocks.
For the sake of example, let’s suppose we accessed Stock Viewer as of June 4, 2004, approximately six months ago. Quick Test shows that three of the top five, seven of the top 10, 11 of the top 15 and 14 of the top 20 stocks have gone up since then. That’s not bad, but we want to do better. So let’s see how the VectorVest graphs could help us.
You can do this by right clicking on the top stock, URBN, clicking on Multiple Graphs, Stock and Standard. Enter 20 in the # of items box; then click on Graph. When the first graph appears, click on the Drop Down Arrow next to the Period Box. Scroll down and click on Custom. Set the Start Date to June 4, 2003 and the End Date to June 4, 2004. This technique allows us to see a one-year, daily graph as it existed six months ago.
The first graph is that of URBN. It shows a classic pattern of what I like to see, a nice steady increase in Price. Note that Price stayed above Stop and RT stayed above 1.00 for the entire year. Click on EPS to the right of the graph. EPS went from $0.46 per share to $0.97 per share. You have to love this stock, so consider it a buy.
The second stock is CTU. We can see immediately that it too has had a nice gain in Price over the 12-month period. But its volatility is somewhat disconcerting. List this stock for further consideration.
The third stock, DYII, is in a recovery mode. Its Value is well above Price, but its EPS is erratic. This looks like a risky play. So let’s give it a pass.
The fourth stock, ESI, is also a recovery play. It’s had two major drawdowns in the past year and its EPS had a down move for about six months. Pass it up.
The fifth stock, KMRT, doesn’t look like the Kmart I used to know. Its Price went from $15.00 to $62.53 in a year and it exploded almost eight bucks on high volume on June 4, 2004. Consider it for further study. Find out what’s going on.
So far we have one stock, URBN, that’s a cherry picker’s buy, two stocks to watch and two to forget about. Once you get used to looking at these graphs, you’ll see that the steadier, rising nature of the Price and EPS patterns for NAVR, TTC, SHFL, CVH, HBP, ITW, ALDN, ALDA, and HURC would make them preferred choices for purchase. Of this group, nine were winners and one a loser since 06/04/04. Now that’s more like what we’re looking for.
Yes, I may have been biased in choosing these stocks by the benefit of hindsight, but try it. Simply look at the graphs of the top 20 stocks ranked by VST. Favor those with distinctly rising Price and EPS patterns. Avoid those with excessive volatility and violent drawdowns. It doesn’t take long to look at 20 graphs and it’s really easy to do. That’s why I call it VectorVest Simple.


Leave A Comment