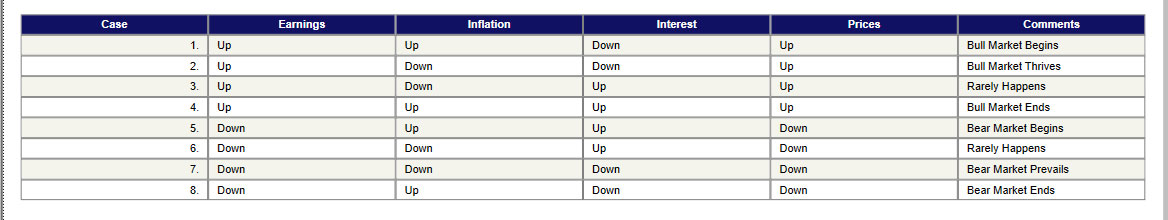
Last week, I introduced you to the “The Truth Chart.” This chart provides an array of the eight possible combinations of earnings, inflation and interest rates which may exist in Bull and Bear markets. We used it last week to chronicle the rise and fall of the market from January 1995 to the present time. As shown below, we are now in a Case (8) scenario.
Click to enlarge
There are several aspects of this chart which should be noted. First of all, it shows that no single factor dictates the fate of the market. For example, it shows that Bull markets begin when earnings are going up and interest rates are going down, i.e., Case(1). Bull markets end, Case (4), while earnings are still rising, but interest rates are also rising. The only difference between Cases (1) and (4) is that interest rates were falling in Case (1) and rising in Case (4). Therefore, it takes a combination of rising earnings and falling interest rates to ignite and sustain a Bull market.
It is also worth noting that combinations of rising inflation and falling interest rates as shown in Case (1) do not last very long. Although Dr. Greenspan has been rather cavalier about inflation for some time now, interest rates have a way of going up when the economy strengthens and inflation rears its ugly head. Be that as it may, the thing we need to see for this Bear market to end is sure evidence of rising earnings.
As you probably know, we track inflation and interest rates each week in the Investment Climate section of the Views. The data on these factors has been easy to obtain and indisputable because it reflects the past. Not so with earnings. The information we needed in regard to earnings is forecasted, and has been subject to considerable error. How many times have we been led to believe that earnings were on the rise when, in fact, they were not? Today’s Wall Street Journal, for example, featured a front page item stating that profits improved in the fourth quarter. That’s nice, but the article within revealed that earnings were down 4.0% for the year. A popular newsletter writer claims that earnings of the 900 companies followed by Business Week were down 35% last year.
So what are we to believe? The answer has been right here before us. Yes, we’re going to begin tracking earnings of the S&P 500 companies as forecasted by VectorVest. We’ll be using the 50-day moving average of forecasted S&P 500 earnings as shown in the summary graph of the S&P 500 WatchList. This data will be analyzed and published in the Investment Climate as The Earnings Indicator.


Leave A Comment