The best indicators for swing trading are what actually signal opportunities to you. But the last thing you want is to fall into the trap of analysis paralysis by relying on too many indicators. We’re here to introduce you to the best swing trading indicators:
- Moving averages (EMA and SMA)
- MACD (Moving average convergence divergence)
- Relative strength index (RSI)
- Bollinger bands
- Volume
- Stochastic oscillator
- Bullish candlestick reversal patterns
- Average true range (ATR)
- Fibonacci retracements
All of these have their place, but the best swing traders simplify their strategy with VectorVest – the #1 stock analysis software for beginner and expert traders alike. Instead of dealing with complicated technical indicators, you can just rely on three simple ratings:
- Relative value (RV): Shows you whether a stock is under or overvalued.
- Relative safety (RS): Helps you assess a stock’s risk profile.
- Relative timing (RT): Indicates how a stock is moving – direction and magnitude.
These sit on a simple scale of 0.00-2.00 with 1.00 being the average for effortless interpretation. Better yet, you’re given a clear buy, sell, or hold recommendation for any given stock based on its overall VST rating. Take the stress out of swing trading with our stock advisory today.
What is Swing Trading and What are Technical Indicators?
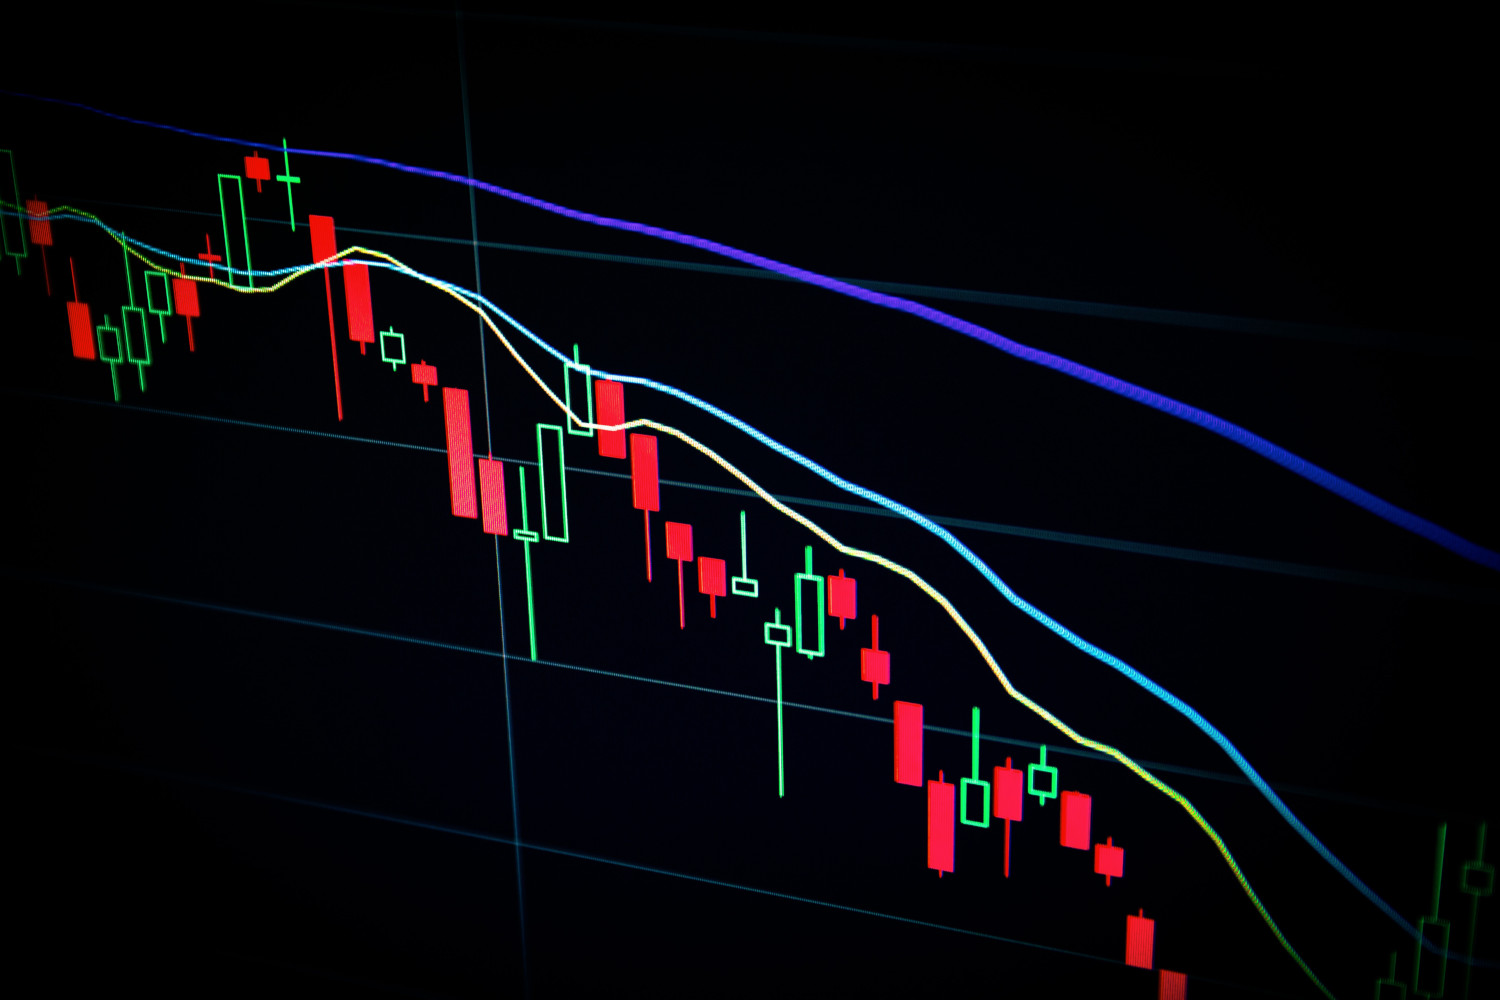
Swing trading is a short-to-medium-term trading strategy that involves capitalizing on temporary fluctuations in a stock’s price along its overall trajectory. You’ll hold positions for at least a few days, but no more than a week or two.
This means you don’t really care about the fundamentals of the company. You will almost exclusively rely on technical analysis to spot opportunities and execute successful trades. That’s where the best indicators for swing trading come into play.
These tools turn price and volume data into simple signals you can read at a glance so you can tools turn price and volume data into simple signals you can read at a glance. There are three types:
- Trend indicators: Show the overall direction of a stock and help smooth out noise. Moving averages are the classic example.
- Momentum indicators: Reveal how strong a trend is and whether it’s at risk of reversing. RSI is a common indicator for spotting overbought or oversold conditions.
- Volume indicators: Measure how many traders are participating in a move, confirming whether a trend has real strength behind it.
But what are the best swing trading indicators? We think there are 9 worth knowing.
The Best Indicators For Swing Trading
So what are the best indicators for swing trading? You don’t have to rely on all of these swing trade indicators for every single investment you make – but it’s worth at least having them in your toolkit. Let’s start with one of the best stock indicators for swing trading.
Moving Averages
Abbreviated as MA, the moving average is one of the best swing trading indicators in technical analysis. You’ll use it to confirm trends in price movement. Because this falls into the category of lagging indicators, you would rarely use the moving average to predict future price movement.
There are two types of moving averages you should be aware of: exponential moving averages (EMA) and simple moving averages (SMA). Both are important, but the exponential moving averages will give you access to the most recent price action.
So, how do you use these moving averages? You’ll need to also distinguish between shorter-term MAs and longer-term MAs. Watch for a short-term moving average that crosses a long-term moving average. When this happens, it may be a good time to buy – this is a bullish signal. Learn more about the best moving averages for swing trading in our blog.
MACD (Moving Average Convergence Divergence)
Another really helpful trend indicator for swing traders is the MACD, or the moving average convergence divergence. This slightly more complex indicator combines the SMA and EMA we discussed above and offers more insights. It helps you confirm a trend while granting you a look into the momentum behind it, too.
MACD calculates the difference between the EMA and SMA. While best practice is to take a 26-period EMA and 12-period SMA, your unique trading style/risk levels may affect the periods you use. You can overlay the MACD on your stock’s chart and watch for it to cross above the signal line as a sign that it’s time to buy. Conversely, it’s time to sell when the MACD crosses under the signal line.
You can also use the MACD to predict reversals. By looking for divergence between the histogram and price action, you can make accurate predictions that a reversal is on the horizon.
RSI (Relative Strength Index)
A pure momentum indicator, the RSI has become the go-to indicator for crypto trading in particular. It helps you identify whether a stock is oversold or overbought based on the magnitude of the price change.
The RSI is displayed as an oscillator. You’ll use this line graph to determine where a stock falls on a range from 0-100. A higher number indicates a more overbought stock, while a lower number indicates an oversold stock.
This is a really important indicator to monitor as it can help you get in or out of a stock at the right time. For example – as the RSI climbs above 70, you can assume the stock is overbought and a reversal is on the horizon. Similarly, as the RSI drops below 30, you can predict an upcoming reversal as the bearish trend ends.
Bollinger Band
This is another of the many lagging indicators you’ll use to assess momentum in a stock’s trend. The Bollinger band tool gives you a look at how high or low a price is relative to previous trades. What does this tell you, though? It indicates how volatile the market is, while also giving you insights into whether the stock is overbought or oversold.
Swing traders love using the Bollinger band because it’s a clean, easy indicator to use. It relies on moving averages along with two standard deviations: one positive, one negative. As the gap between these standard deviations widens, market volatility increases. As these standard deviations start to converge on the moving average, there is less volatility.
Volume
The volume indicator is perhaps the most simple of all – but also one of the most important. It shows you exactly how much of a stock is being traded, and how distinguished a newly formed trend is.
The more volume, the more people are buying/selling a stock. This helps you confirm the trend. High volume means a strong trend, whereas weak volume indicates a weak trend. Simple enough, right? And yet – so many swing traders overlook this helpful indicator. Don’t make the same mistake.
Stochastic Oscillator
The final indicator we want to cover is the Stochastic oscillator. This is yet another momentum indicator. While it gives you access to the same type of information as the relative strength index, it does so using different mathematical models. You’ll look at the same 0-100 range as the RSI, but the overbought and oversold levels fall at 80 and 20 respectively.
And, instead of a single line on a chart – you’ll have two. The first, of course, is the stochastic oscillator. The other is a 3-day moving average. Why? Because when the two lines close in on each other and end up crossing, it indicates a reversal is coming.
Bullish Candlestick Reversal Patterns
These swing trading patterns suggest that the support has a high probability of holding and that the advance has begun. There are quite a few different candlestick patterns out there, but a few worth following are:
- Bullish engulfing
- Hammer
- Morning Star
Following these patterns requires validation of their strength through volume indicators. Once you see a hammer, for example, you should watch for a rise in trading volume to confirm the pattern before entering.
Average True Range (ATR)
ATR shows you how volatile a stock has been over a set period. Swing traders use it to judge whether a move has enough “room” to develop or if the stock tends to whip around too much for their risk tolerance. It doesn’t point up or down, it just measures the size of recent price swings.
It’s one of the best indicators for swing trading because you can set stop-loss levels that match the stock’s personality. A higher ATR calls for wider stops, while a low ATR means the stock moves in a tighter range.
ATR also helps you identify shifts in volatility that may accompany a breakout, breakdown, or exhaustion. Expanding volatility after a calm stretch is a common signal that another meaningful swing is underway.
Fibonacci Retracements
Last but not least on our list of the best swing trading indicators, we have fibonacci retracements – which can help you map potential pullback levels after a strong move.
Swing traders use them to pinpoint where buyers or sellers may step back in – most often around the 38.2%, 50%, and 61.8% retracement levels. These are just reference points – not guarantees – but they certainly make it easier to figure out her a pullback is healthy or starting to erode the underlying trend.
You’d typically drop Fibonacci levels on a clear swing high and swing low, then watch how price reacts as it retraces. If the stock finds support near one of these levels and resumes its move, you have a clean setup for an entry. On the other hand, it signals a deeper correction ahead when it cuts through these levels with conviction.
Swing Trading Indicators Simplified With VectorVest
These are the best indicators for swing trading. But the reality is, even the best swing trading indicators can get overwhelming. What if technical analysis could be brain-dead simple? With VectorVest, it can be.
Our tool is one-of-a. It will transform the way you trade forever. It combines all indicators into three easy-to-understand metrics: Value, Safety, and Timing. You can quickly pull up any given stock in the software and immediately be given these metrics – which range from 0-2.
Relative Value (RV)
Relative value shows you whether a stock is undervalued or overvalued. A stock rated with an RV above 1.00 has an above-average appreciation potential. On the other hand, a stock with an RV under 1.00 is a red flag – it’s overvalued.
Relative Safety (RS)
Along with the value of a stock, you should consider its safety. An RS over 1.00 indicates it’s safer and less volatile than a stock under 1.00. Your specific risk tolerance will affect the manner in which you use RS.
Relative Timing (RT)
Perhaps the most important metric of the three. It tells you how the short-term performance of a stock looks. Anything over 1.00 is good, and below 1.00 means that the timing isn’t quite right. A flat price trend will just sit at 1.00.
Assess Overall Market Conditions With Ease
Are things trending up over the past 10 days, or are they trending down? This information should influence your strategy. VectorVest simplifies this, too. You can assess the overall market sentiment right on the home page of our platform – we tell you whether it’s a good time to buy stocks in general, or whether you should consider closing your positions and converting to cash.
Evaluate Industry & Sector Performance
VectorVest helps you evaluate industry and sector performance so you can enter industries or sectors of the economy that are on your side. If a particular industry is going through a downturn, you probably wouldn’t want to stake a position in stocks that fall under that industry. But how can you tell whether an industry or sector is performing well or not?
In the VectorVest platform, simply load the industry group on the viewers page. Then, resort by RT (relative timing). You’ll be presented with industries that are prime for entering positions in.
Pick The Highest VST And Win Your Trades
These three metrics make up the VST (value, safety, timing) rating we give a stock. This is how we’re able to give you a clear recommendation of buy, sell, or hold for any given stock. The best indicators for swing trading are great, but why not work smarter with VectorVest? See what it looks like in action with a free stock analysis today.
Final Thoughts On The Best Indicators For Swing Trading
Now that you know the best indicators for swing trading, you’re ready to get started doing technical analysis like the pros. But the reality is that even the best swing trading indicators are outdated. Why not make things easier on yourself with a proven trading system like VectorVest?
Take the stress out of finding swing trading stock picks with VectorVest. You’ll get market guidance, time-tested investing strategies, and individual stock recommendations. You can learn more about how VectorVest compares to Seeking Alpha vs Morningstar or Motley Fool vs Seeking Alpha in our blog.
Or, just get started today with a 30-day free trial. Experience the difference for yourself and you’ll never go back to trading the old way.
Frequently asked questions
Do technical indicators really work?
They’re not foolproof, but the best indicators for swing trading can definitely help you make more calculated decisions. You have to understand what each one measures and use them with real price action rather than looking at them as stand-alone signals.
How do moving averages help swing traders?
They smooth out price movement so you can see the dominant trend. Crossovers between short-term and long-term averages are good gauges for when you should enter/exit a position.
Should you use the MACD indicator for swing trading?
MACD is one of the best swing trading indicators because it shows both trend direction and momentum. Many traders watch for MACD crossing its signal line to spot shifts in strength.
What about the VWAP indicator?
We didn’t talk about volume weighted average price (VWAP) in this guide to the best stock indicators for swing trading, but it does have its place. It shows a stock’s average price based on volume, so you can see if a stock is undervalued or overvalued.
Which RSI settings work best for swing traders?
Most swing traders stick with the standard 14-period RSI. It’s the best time frame for swing trading because it reacts quickly enough for short-term moves without adding too much noise.
How do you predict a stock’s movement with technical indicators?
Indicators help you read trends, momentum, and volatility. You’re not predicting the future – you’re making a calculated decision based on what the chart is showing you.
How many of these swing trading indicators should I use?
Pick two or three of the best indicators for swing trading to avoid dealing with conflicting signals and slowing down your decision-making.
What’s the 1% rule for swing trading?
It limits your risk to 1% of your account size on any single trade. It helps keep losses manageable during volatile swings – because even with the best swing trading indicators, losses can occur!
What is the best indicator for swing trading?
There isn’t a universal “best.” Moving averages, MACD, RSI, and volume each serve a different role. But whether you’re looking for the best stocks for covered calls, aggressive growth stocks, or the best stocks for Roth IRA, the VST rating from VectorVest simplifies everything. No need to deal with complicated swing trading indicators. It gives you a clear buy, sell, or hold rating for any given stock at any given time!


Leave A Comment