by Leslie N. Masonson, MBA
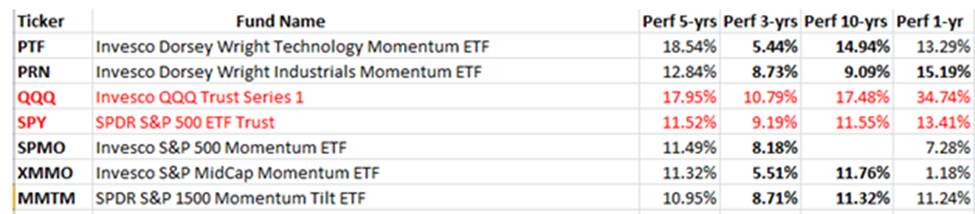
This is the third part of a series on ETF Momentum investing with the last two articles published on this blog on November 11 and 18, respectively. The first article was an introduction to ETF momentum investing, while the second article provided ETF multi-year performance over four time periods. This article focuses on the five top performers which are shown in the table below in bold print. Note that all the data presented in this article was from ETFAction.com
Believe it or not the iShares MSCI USA Momentum Factor ETF (MTUM) was a top 10-year performer with an annualized return of 11.42%, but in the last three-year and five-year periods, it has been a laggard with returns of a measly 1.11% and 7.26%, respectively. Therefore, that ETF is no longer considered a performance leader. The five-year performers (as shown in last week’s more extensive table) top ranked ETFs are displayed below:
.
As you can see, all these ETFs had a hard time beating the two popular indexes printed in red ink. Nevertheless, investors may want to have a small position in one or more of these ETFs, in case they spring to life in the future, since momentum investing is a well-known concept that has lengthy periods of market outperformance, as well as underperformance.
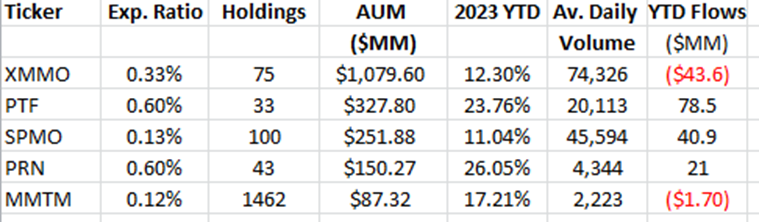
Let’s look at some key metrics:
.
All these ETFs are open-ended ETFs, provide quarterly dividends, are not leveraged, and have a 100% exposure to U.S. equities. Interestingly, MTUM (not shown on the table) , sponsored by BlackRock, has huge assets of $8.2 billion with a year-to-date performance of 5.03%, a very poor performance compared to the others on the table. This ETF’s inception date was April 16, 2013 and the fifth momentum ETF to come to market, yet it gathered the vast majority of the assets in the category, quite an impressive asset gathering feat in light of its less than stellar price appreciation over the last five years. Surprisingly, XMMO which was the first ETF in this category after its initial market entry date of March 3, 2005, was only able to capture just over $1 billion in AUM.
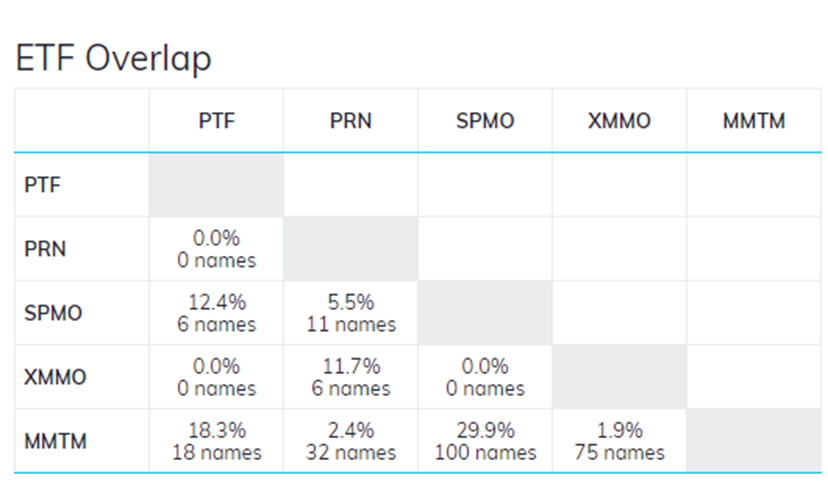
The diagram below indicates the number of stocks held in common by different combinations of these ETFs. Clearly, MMTM and SPMO at nearly 30% overlap have the most names in common, yet MMTM has beaten SPMO in the year-to-date performance by a considerable six percentage points. MMTM is sponsored by State Street, and of course the other ETFs are sponsored by Invesco.
.
The largest 15 positions held by three of these ETFs all contain the following stock tickers in order of dollar magnitude: NVDA, AVGO, BLDR, JBL, SAIA, ORCL, AME, ODFL, TT, CPRT, PH, FICO, PANW, PWR, and TD.
Based on all the data presented above, I recommend Invesco Dorsey Wright Technology Momentum ETF (PTF) as the best choice in this category for the following reasons:
- Focus on technology which will always be a popular and dynamic category
- Best overall 5-year performance, even against both benchmarks
- Nearly 24% year-to-date performance compared to 20.4% for S&P 500 Index and 46.9% for the NASDAQ Composite as of November 27
- Best 10-year return, even outpacing S&P 500
- Positive year-to-date flows of $78 million
On the negative side of the ledger, the very low trading volume of around 20,000 shares a day may result in a larger than normal bid-to-ask spread. That shouldn’t be a problem for investors, but would be traders who should not use this ETF for active trading. Moreover, the 33 positions in this concentrated portfolio present a problem when technology stocks enter the next bear market, which is inevitable. Therefore, market timing is critical and that is where VectorVest shines with the Daily Color Guard and timing tools such as the Green Light Buyer, DEW and Primary Wave.
Investors interested in PTF, or any of the other ETFs mentioned here should check out all the details on the Invesco website including the portfolio composition, turnover ratio, and other factors before putting any money at risk.


Want These Types of Insights at Your Fingertips so You Can Win More Trades?
Use VectorVest to Analyze any stock free. VectorVest is the only stock analysis tool and portfolio management system that analyzes, ranks and graphs over 18,000 stocks each day for value, safety, and timing and gives a clear buy, sell or hold rating on every stock, every day.
Before you invest, check VectorVest! Click here to ANALYZE ANY STOCK FREE and see our system in action!


Leave A Comment