By Leslie N. Masonson, MBA
HCI Group, Inc. (NYSE:HCI), was incorporated in 2006 in Tampa, Florida where it is currently headquartered. It has $507 million in annual sales and a market capitalization of $737 million with 578 full-time employees. The company was formerly known as Homeowners Choice, Inc. and changed its name to HCI Group, Inc. in May 2013. Over the past year the company’s stock price has jumped 121% with much of the increase occurring since September.
The company is a property/casualty business player, as well as offering reinsurance, real estate, and information technology. Moreover, it provides individual home-owner and condo insurance. Additionally, it owns waterfront properties and retail shopping centers. Recently, HCI took over 53,750 policies from the Florida state-backed Citizens Property Insurance Corporation. The company is able to offer potential policyholders competitively priced renewals and increased coverage compared to its competitors. Zacks rates the company a strong buy because of recent earnings surprises and future estimates.
HCI Inc. is probably not a well-known a name to most investors which is the same for most small to midsize insurance firms, but HCI has landed at the #1 ranking in both VectorVest’s Insurance (Property/Casualty group) out of 64 stocks), and the more broader Insurance sector. This is a noteworthy and remarkable achievement.
This insurance sector contains five industry components and the Insurance (Property/Casualty) segment ranks a decent 52 out of 222 industries tracked by VectorVest which is in the top 25% of the category. Therefore, HCI has not only outpaced its competitors, but it has also a high VST stock ranking (7th out of 9,138) which translates to the top 0.07% of all stocks. These characteristics are very unusual and attest to the stock’s positive positioning going forward.
Moreover, 189 institutions hold 69% of their 8.6 million shares outstanding with management holding a very significant 30% stake. Among the top three holders are Blackrock Inc. with 19% of the shares, Vanguard with 8%, and Dimensional Fund Advisors LLP with 4%. The interest in this company by these large institutions shows their attraction to this leading company, and is another positive indicator of future potential. Currently, there are five analysts covering the stock.
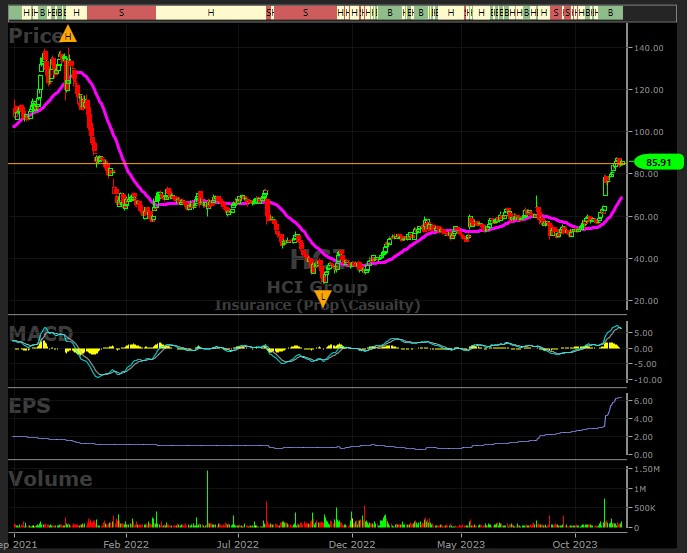
One cautionary factor is that the MACD just crossed downward, so it needs to reverse and cross upward before any purchase is considered. Also, the price is 25% above the 40-dma, as well as 58% above its 200-day moving average which is excessive and may result in a regression closer to 40-dma. That means the price may remain in a trading band or perhaps shed 10-20% of its recent gain, if the stock adjusts lower. The RSI (14) reading (not shown on the graph) is at 72.7, a high level, and a bit overbought, but nothing to be concerned about.
HCI Inc.’s Five “Excellent” Metric Ratings, November Yearly High, and Significant Undervaluation Are Positive Signs Going Forward
The VectorVest software issues buy, sell, or hold recommendations on 9,141 stocks. This proprietary stock rating system splits the data into three simple ratings: relative value (RV), relative safety (RS), and relative timing (RT). Each is measured on a scale of 0.00-2.00, with 1.00 being the average for quick and easy interpretation, and 2.00 being the best.
The VectorVest ratings for HCI are as follows:
- Excellent Upside Potential: The Relative Value (RV) rating focuses on a stock’s long-term, three-year price appreciation potential. The current RV rating for HCI is 1.58 which is exceptionally high. Moreover, VectorVest determined HCI to be significantly undervalued with a calculated value of $119.53 that is an impressive 39% higher than its current price of $85.91.
- Fair Safety: The Relative Safety (RS) rating is based on the company’s business longevity, financial predictability/consistency, debt-to-equity ratio, and additional risk parameters, including price volatility. Its RS rating of 0.91 is below average, indicating above average risk. Therefore, long-term conservative investors may find this stock too risky.
- Excellent Timing: The Relative Timing (RT) rating focuses on the price trend over the short, medium, and long term. The components include price direction, dynamics, and price magnitude of price changes over daily, weekly, quarterly, and yearly comparisons. HCI has an exceptionally high RT rating of 1.78 compared to the average 1.02 RT of all the stocks in the database.
- Excellent Comfort Index: This index measures the consistency of a stock’s long-term resistance to severe and lengthy corrections. This index compares the individual stock to the fluctuation of the VectorVest Composite price. With a CI rating of 1.67, HCI rating is exceptional and well above average. Therefore, this is another positive metric for all long-term conservative investors.
- Excellent Growth Rate (GRT): HCI has annual sales of $507 million and a 39% forecasted growth rate measured over a forecasted three-year period which is exceptional. However, its sales growth of 4% over the last year is considered fair. These two fundamental factors provide evidence of a growing company on the path to future growth. Additionally, these factors are calculated in the VectorVest software, so you don’t have to try to find these numbers on other websites.
- Excellent VST Score: The VST Master Indicator ranks 9,141 stocks from high to low and brings to the top of the rankings those stocks with the highest VST scores. HCI’s score is 1.48. Using VST enables users to determine stocks that are performing much better than average, as well as the opportunity to find the cream of the crop with a few mouse clicks. HCI certainly falls into that category.
With an increasing EPS trend, and a current ROE of 18.4%, this stock has all of the key characteristics of a long-term winner. Plus it offers a 1.87 dividend yield. Moreover, its Beta of 0.88 (which means it is 12% as volatile as the S&P 500 Index) is another plus for most investors with a lower risk tolerance. The average daily volume of 92,200 shares is not high, but certainly sufficient for investors looking for a multi-year hold.
VectorVest currently rates HCI a “Buy” as of October 31 at $58.97. Since then, the stock has soared to $87.90 before settling back to $85.91 this past Friday. Based on all the stock’s positive characteristics, this stock should definitely be placed on investors’ watchlists.
Look for a timely entry above $87.90 to indicate that the stock can clear its current 5-day consolidation area. The Daily Color Guard had a “Confirmed Up” and Bullish call on November 24 and currently has three green lights as of the Friday close, meaning investors can buy stocks with the wind in their back. This adds another level of positive market confirmation of a potentially rising market. Likewise, if the stock price reverses below $83.79, then no action should be taken until any downdraft has subsided and the price begins to stabilize and move higher with the MACD is a positive position.
You can easily check out VectorVest’s future ratings on this stock before making any move. Analyze HCI free using VectorVest to determine the current recommendation which can change at any time based on market conditions.


Want These Types of Insights at Your Fingertips so You Can Win More Trades?
Use VectorVest to analyze any stock free. VectorVest is the only stock analysis tool and portfolio management system that analyzes, ranks and graphs over 18,000 stocks each day for value, safety, and timing and gives a clear buy, sell or hold rating on every stock, every day.
Before you invest, check VectorVest! Click here to ANALYZE ANY STOCK FREE and see our system in action!


Leave A Comment