
by Leslie N. Masonson, MBA
Blackstone Inc., a NYSE-listed firm (BX), founded in 1985 by Stephen A. Schwarzman and Peter G. Peterson, went public in 2007. It is headquartered at 345 Park Avenue in New York City, with a workforce of nearly 4,700 and revenues of $7.3 billion, and a market-cap of $132 billion. The firm is engaged in alternative asset management with a focus on private equity, leveraged buyout, commercial real estate, hedge funds, public debt and multi-asset tactics. The stock has a wide following on Wall Street with 1,923 institutions owning 64% of the outstanding shares. Don’t confuse Blackstone Inc. with BlackRock (BLK), a competitor with $9.4 trillion of AUM, run by Larry Fink. Interestingly, Blackstone’s market-cap is higher than Blackrock’s which stands at $113 billion.
The Wall Street Journal on Friday, July 21, 2023 had two articles on Blackstone with one titled: “Blackstone Still Has Plenty Ways to Grow.” The other mentioned its attainment of a $1 trillion in AUM in the second quarter of 2023.
What does VectorVest have to say about this company’s prospects going forward? That’s the focus of this article. Let’s first take a look at the net earnings per share (EPS) for the last four years—2019 through 2022. In calendar order they were: $3.03, then $1.50, then $8.14, and lastly $2.36. Yet, in the most recent quarter there were some upticks in certain key numbers. This EPS rollercoaster ride does not instill investor confidence in being a future stable earnings grower, considering that the gigantic EPS plunge from December 2021 to December 2022.
Now let’s check out how BX is ranked in VectorVest’s various business categories. It is ranked #29 in the Financial Management industry grouping among 129 companies, as well as ranked #106 in the 367-stock broader financial sector, both rankings right around the bottom of the first quartile – nothing to write home about. BX is certainly not a top performer in those two categories, so that is its first strike against it.
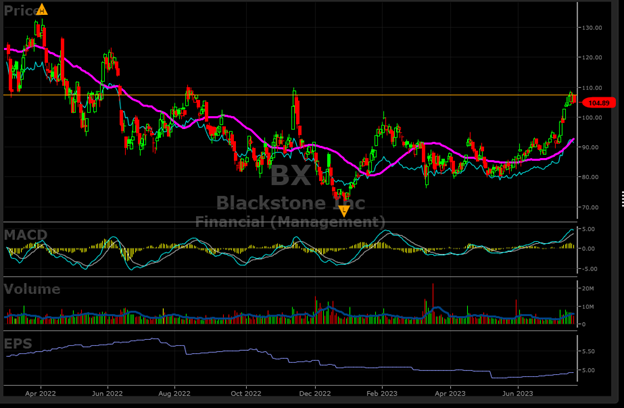
The second strike is its volatility where the stock price has been on a roller-coaster ride over the past 2.5 few years, requiring any buy-and-holders to wear a hard-hat and be tightly strapped in for the wild ride. Currently, the price is still 50% below its all-time high registered on November 19, 2021 at $146.44. Thereafter, the price was in a downtrend (see chart below) until it hit bottom on December 28, 2022 at $71.72, a drop of 52.1%.
The stock rallied to $100.03 by February 2, 2023 up 39.5% before plunging again to a low on March 13, 2023 to $83.48, a decline of 23.8%. Since then, it was in a trading range until June 30, before jumping 10% in about 10 trading days reaching a double top near $109.
BX Has Mostly Inferior VectorVest Scores, Is Overvalued and Has A Negative Earnings Trend
VectorVest’s blow average metrics for BX are a third strike:
- Poor Upside Potential: The Relative Value (RV) rating focuses on a stock’s long-term, three-year price appreciation potential. The current RV rating for BX is 0.80 which is significantly below average on a scale of 0.00-2.00. The current stock price is $104.89, while VectorVest places its value at $75.49, so it is measurably overvalued by over 25%.
- Fair Safety: The Relative Safety (RS) rating is based on the company’s business longevity, financial predictability/consistency, debt-to-equity ratio, and additional risk parameters, including price volatility. Its RS rating of 0.89 is below average, indicating above-average risk, which makes it unsuitable for conservative investors.
- Very Good Timing: The Relative Timing (RT) rating focuses on the price trend over the short, medium, and long term. The components include price direction, dynamics, and price magnitude of price changes over daily, weekly, quarterly, and yearly comparisons. BX has a high RT rating of 1.40 compared to the average of 1.03 for all the stocks in the database which means that the stock has been an above average superior performer over multiple timeframes. However, we have seen its extreme volatility and that is another problem. BX’s RT has increased significantly since December 28 from 0.50 to 1.38 which shows a strong price performance. This is about the only positive metric going for BX.
- Poor Comfort Index: This index measures the consistency of a stock’s long-term resistance to severe and lengthy corrections. This index compares the individual stock to the fluctuation of the VectorVest Composite price measured on a scale of 0 to 2.00. At a level of 0.52, BX’s rating is extremely low. Therefore, this stock is only suited for aggressive investors with high risk tolerance.
- Very Poor Growth Rate (GRT): BX’s current sales growth over the last 12 months has been negative 30%, with an accompanied negative 6% forward-looking growth rate which are both exceptionally poor. The latter is measured over a forecasted three-year period. As these important fundamental factors are captured in the software, you can quickly get a picture of the company’s challenging and troubling financials.
- Fair VST Score: The VST Master Indicator ranks 9,133 stocks from high to low and brings stocks with the highest VST scores to the top of the list. BX’s VST is 1.09, slightly above average. Using VST enables subscribers to identify stocks that are performing much better or worse than average, and BX is clearly not a winner here.
To sum up, the metrics reviewed above with the weak Relative Value rating of 0.81 and the weak Relative Safety Rating of 0.89 have both weighed negatively on the VST value, keeping it at a mediocre level of 1.08. Unquestionably, BX has had strong recent price performance as measured by RT, but the ride has been bumpy and inconsistent, and that factor is only one of three to consider in purchasing any stock.
If you have interest in Blackstone or its sector, check it out in the software. If you don’t currently subscribe to the software, then take a 30-day trial to see its incredible power in identifying the top-ranked stocks within a given sector or the market as a whole.


Want These Types of Insights at Your Fingertips so You Can Win More Trades?
Use VectorVest to Analyze any stock free. VectorVest is the only stock analysis tool and portfolio management system that analyzes, ranks and graphs over 18,000 stocks each day for value, safety, and timing and gives a clear buy, sell or hold rating on every stock, every day.
Before you invest, check VectorVest! Click here to ANALYZE ANY STOCK FREE and see our system in action!


Leave A Comment