
Block (SQ), previously known as Square, delivered their fiscal 4th quarter earnings yesterday after the market closed. The report was mixed, with EPS coming in below expectations despite revenue & profit outperforming expectations.
Revenue came in at $4.65 billion, narrowly beating Wall Street’s estimate of $4.61 billion. The company reported a solid gross profit of $1.66 billion, up 40% from the same period last year. Analysts were looking for just $1.53 billion.
Despite the impressive gross profit figure, the company did report a net loss for the quarter of $114 million – or 19 cents per share. But the figure that really left analysts and investors alike underwhelmed was EPS. Block missed estimates of 30 cents/share, reporting just 22 cents/share.
Much of the company’s financial success in 2022 as a whole can be attributed to the Cash App segment, which saw 64% growth in gross profit for a total of $848 million. Square, the company’s POS segment, grew gross profits by 22% for a total of $801 million.
Yesterday, analysts were expecting this news to drive SQ up in the stock market. And while shares did spike 8% in extended trading, they quickly corrected as the market opened. As of 11 AM EST, SQ is up just under 2%.
Nevertheless, the stock is up 18% in the last 3 months – and investors are hoping the market focuses on the positives from this earning report and ignores the misses. However, in looking at SQ through a tried-and-true stock analysis system, we see one major issue holding it back. Want to discover what your next move should be with this stock? We’ve fully broken SQ down through the VectorVest stock analysis software below.
Despite Fair Safety and Timing, SQ Has Poor Upside Potential...
The VectorVest system helps you uncover and assess opportunities in the stock market with a simple, proprietary stock-rating system. You’re given all the insights you need to make informed, emotionless decisions in just three ratings: relative value (RV), relative safety (RS), and relative timing (RT).
Each of these ratings sits on a scale of 0.00-2.00, with 1.00 being the average - which makes interpretation quick and easy. Just pick stocks with ratings over the average and win more trades!
But to make things even simpler, VectorVest provides you with a clear buy, sell, or hold recommendation based on these 3 ratings for any given stock, at any given time. As for SQ, here’s the current situation:
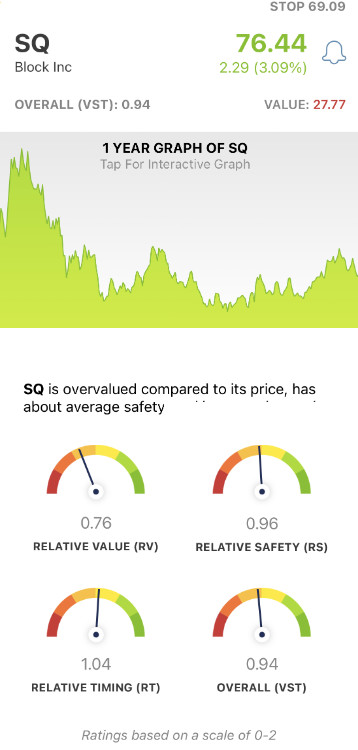
- Poor Upside Potential: The RV rating assesses a stock’s long-term price appreciation potential (three years out) compared to AAA corporate bond rates and risk. And right now, the RV rating of 0.76, which is poor. Moreover, the stock is overvalued right now, with a current value of just $27.77/share.
- Fair Safety: In terms of risk, SQ is fairly safe - with an RS rating of 0.96. This is calculated from the company’s financial consistency and predictability, debt-to-equity ratio, and business longevity.
- Fair Timing: The price trend for SQ right now is moving in the right direction - but it needs more momentum to really solidify it. The fair RT rating of 1.04 is just above the average. This rating is based on the direction, dynamics, and magnitude of a stock’s price movement day over day, week over week, quarter over quarter, and year over year
The overall VST rating of 0.94 is fair for SQ - but it is below the average. With that said, what should you do with this stock as an investor? If you’d like to make your next move with confidence, get a clear buy, sell, or hold recommendation through a free stock analysis today.


Want These Types of Insights at Your Fingertips so You Can Win More Trades?
Use VectorVest to Analyze any stock free. VectorVest is the only stock analysis tool and portfolio management system that analyzes, ranks and graphs over 18,000 stocks each day for value, safety, and timing and gives a clear buy, sell, or hold rating on every stock, every day.
VectorVest advocates buying safe, undervalued stocks, rising in price. Right now, SQ has poor upside potential with fair safety and timing.
Before you invest, check VectorVest! Click here to ANALYZE ANY STOCK FREE and see our system in action!


Leave A Comment