
Five9, Inc. is a cloud contact center software provider and recently reported its fourth quarter and full-year results for 2022. Despite the company’s impressive results—which included record revenues of $208.3 million, up 20% from the same period the year prior—its stock price (FIVN) dropped 9.5%.
Analysts predicted quarterly earnings of $0.41 per share, but Five9 actually earned $0.54 per share—a 31.71% surprise. Compared to the same period a year prior, non-GAAP earnings increased by almost 50%, from $0.37 to $0.54 per share. After announcing the 2022 business financials, the stock price dropped, leaving investors wondering why.
To look more into the financial history, earning estimates in the first quarter of 2023 target the midpoint of $207.5 million, slightly below analyst estimates of $209 million. The annual revenue financial guidance for 2023 is in line with expectations at $901.5 million—a 15.7% growth, significantly less than the 28.2% growth seen throughout 2022.
Although stock price after earnings announcements usually correlates with estimates revisions, which are currently mixed, the drop in stock price is likely due to concerns regarding Five9’s future growth rate. There was a net loss of for the fourth quarter of $13.7 million, significantly more than $3.6 million in Q4 2021. While there was a lot of information about Five9’s performance, this factor stood out among mostly positive news.
Revenue guidance for 2023 suggests that they may be unable to sustain their momentum from the prior year, which could be seen as a sign of slower growth going forward. Additionally, Five9’s competition in the cloud contact center service sector remains strong, so investors were likely concerned about how long Five9 can maintain its competitive edge.
Stock growth since the IPO has been impressive, but investors may seek more evidence of sustainable growth in Five9’s future. With the stock dip, now might be a good time for investors to consider whether Five9 is an appropriate choice for their portfolio. Despite the concerns from investors, there are still reasons to be optimistic about Five9’s financial performance moving forward.
The company has performed well since the IPO, increasing over 18,000% and generating solid revenues from its cloud contact center software services business. Additionally, the profit margin was 53.8% in Q4 2022—a substantial increase from the 46.4% seen at this time last year—which signals that margins should remain healthy going forward as well.
Operating cash flow is also significantly higher, at 32.7 million in Q4 2022, up from 8.6 FIVN million in the same quarter of 2021. Compared to the S&P 500, which has gained 4.1% throughout 2023, FIVN has increased 16.1%, outpacing the market. This is a positive sign that Five9 can still generate strong returns despite the recent stock dip.
Ultimately, investors should analyze the financial performance of Five9 and make an informed decision based on their individual investing strategies. The company has seen impressive growth since its IPO and continues to beat analyst estimates despite concerns about future revenue growth. Its profits remain healthy, its operating cash flow is growing, and its stock price has outpaced the S&P 500 in 2023.
Therefore, all signs point to Five9 continuing to be a viable investment option in the cloud contact center services industry. To determine whether this is the case, or if there are potential risks to consider on the horizon for FIVN, let’s turn to VectorVest stock analysis. The VectorVest stock forecasting tool provides scores that provide investors with a thorough analysis of the company’s financial performance. Here are the major takeaways…
Five9 Shows Growth, While Share Prices Fall—Here Are the Forecasting Takeaways to Know...
The VectorVest system changes the way you trade for the better. It tells you everything you need to know about a stock in 3 ratings: relative value (RV), relative safety (RS), and relative timing (RT). Gaining insights from these ratings is fast and straightforward, as they sit on a simple scale of 0.00-2.00. Pick stocks with ratings above the average of 1.00 and win more trades!
Making things even easier, the VectorVest system provides you with a clear buy, sell, or hold recommendation based on these ratings. No more guesswork, no more emotion clouding your judgment. As for FIVN, here’s the current situation:
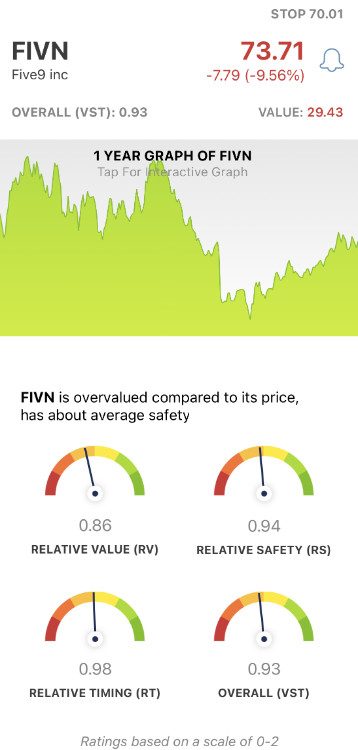
- Fair Upside Potential: With a Relative Value score of 0.86 on a scale from 0.00 to 2.00, FIVN is rated below the average of 1.00, suggesting that there is not much upside potential in the stock right now. While financial performance is stronger than in previous years, VectorVest calculates a current value of $29.43 per share, compared to a price of $73.71, making it overvalued.
- Fair Safety: With a Relative Safety score of 0.94, FIVN is about as consistent and predictable as most stocks in its category. This is calculated based on the company’s financial consistency and predictability, debt-to-equity ratio, and business longevity.
- Fair Timing: The Relative Timing of FIVN is 0.98, meaning this is neither a good time to buy nor sell the stock. This rating is calculated based on the trend’s direction, dynamics, and magnitude. It’s analyzed day over day, week over week, quarter over quarter, and year over year so you have the full viewpoint.
Overall, VectorVest gives FIVN a VST rating of 0.93 - which is fair. Does it earn FIVN a buy in the VectorVest system, though? To get a clear answer on your next move with this stock use our free stock analyzer here.


Want These Types of Insights at Your Fingertips so You Can Win More Trades?
Use VectorVest to Analyze any stock free. VectorVest is the only stock analysis tool and portfolio management system that analyzes, ranks and graphs over 18,000 stocks each day for value, safety, and timing and gives a clear buy, sell, or hold rating on every stock, every day.
VectorVest advocates buying safe, undervalued stocks, rising in price. As for FIVN, it is an all-around fair stock with fair upside potential, safety, and timing.
Before you invest, check VectorVest! Click here to ANALYZE ANY STOCK FREE and see our system in action!


Leave A Comment