
By Leslie N. Masonson, MBA
Brady Corporation (BRC), a NYSE firm incorporated in 1914, is headquartered in Milwaukee, Wisconsin. Currently, the company employs 5,600 individuals and has 44 million shares outstanding. BRC has reported revenues totaling $1.32 billion and annual sales of $1.33 billion. BRC’s market capitalization stands at $2.5 billion, and it pays a dividend of $0.94 per share, yielding 1.71%.
Brady Corporation manufactures and provides identification solutions and products for workplace safety to uncover and protect buildings, grounds, and individuals on a global basis. In this regard, they produce a wide variety of materials, systems, and identification tags, including RFIDs, barcodes, safety signs, marking tapes, software, wristbands, printing systems, and many other accompanying products.
The company provides its expansive product line to electronic manufacturing firms, healthcare providers, chemical, oil, and gas producers, as well as automotive and aerospace companies. They use a direct sales force, distributors, and digital networks.
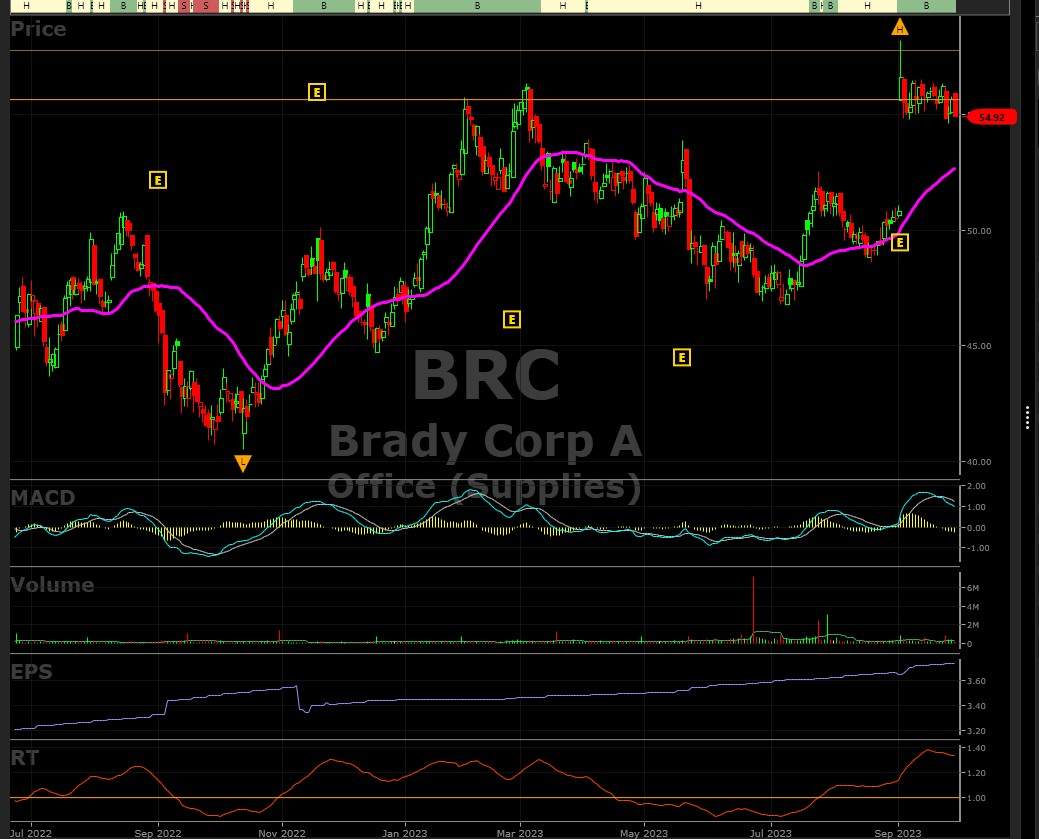
Brady Corporation’s stock price is currently within a 19-day trading range (see chart below) of $54.81 to $56.60 since September 5, following a positive earnings report on that day when the stock surged by 10% from the previous day’s close. From its low of $48.60 on August 21, it has climbed to $58.20 on September 6, marking a 19.8% increase in just ten trading days. Moreover, it has risen by 29.9% since its low on October 13, 2022. Notably, BRC has maintained its recent VectorVest ‘Buy’ rating since September 5th. As you can see, the stock may either break out to the upside or downside of this range. Therefore, checking VectorVest’s ratings, including its chart, will help determine whether a buying opportunity exists.
While most investors may not be familiar with this firm, it has garnered the attention of 303 institutional investors, which is a substantial following for a small-cap company. Collectively, these firms own 86% of the outstanding shares, while insiders hold a minimal 3.7% stake. Well-known institutional investors include Vanguard, with a significant 20% position, followed by BlackRock Inc. with an 11.1% position. In third place is State Street Corporation, with 8.8%.
BRC is categorized under VectorVest’s ‘Office (Supplies)’ category and holds the top rank among 5 companies in this category. Furthermore, it also secures the top position in the broader Office sector, which comprises 10 stocks. This is particularly noteworthy, considering that the group itself is ranked #15 in Relative Timing (RT) out of 222 tracked industries, signifying an exceptionally high ranking in the top 10% of all industries. Usually, it is highly beneficial for a stock to belong to such a highly-ranked group since similar stocks often move together.
Brady Corporation Offers Compelling Metrics, Is Under Valued by 31% and Is Nearing a Five-Time Previously Hit Resistance Level
The VectorVest software issues buy, sell, or hold recommendations on 9,164 stocks/ETFs. This proprietary stock rating system splits the data into three simple ratings: relative value (RV), relative safety (RS), and relative timing (RT). Each is measured on a scale of 0.00-2.00, with 1.00 being the average for quick and easy interpretation, and 2.00 being the best.
As for BRC, its current metrics are as follows:
- Very Good Upside Potential: The Relative Value (RV) rating focuses on the stock’s long-term, three-year price appreciation potential. BRC currently holds an RV rating of 1.39, which is well above average. The current stock price is $54.92, and VectorVest places its value at $71.87, indicating that the stock is considerably undervalued with a potential upside potential of 30.9%.
- Good Safety: The Relative Safety (RS) rating is based on the company’s business longevity, financial predictability/consistency, debt-to-equity ratio, and additional risk parameters, including price volatility. Its RS rating of 1.19 is above average, indicating below-average risk, which makes it a reasonable candidate for conservative investors.
- Very Good Timing: The Relative Timing (RT) rating focuses on the price trend over the short, medium, and long term. The components include price direction, dynamics, and price magnitude of price changes over daily, weekly, quarterly, and yearly comparisons. BRC boasts a reasonably high RT rating of 1.29, well above the database average of 0.82. This indicates that the stock has consistently outperformed across various timeframes.
- Fair Comfort Index: This index measures the consistency of a stock’s long-term resistance to severe and lengthy corrections. This index compares the individual stock to the fluctuation of the VectorVest Composite price. BRC’s rating of 1.07 is slightly above average. This near average reading may make it too risky for conservative investors.
- Very Good Growth Rate (GRT): BRC’s current sales growth rate over the past 12 months has been a rather lackluster 7%, but its forward-looking earnings growth rate is 15% (measured over a forecasted three-year period). These two factors, among many others, are captured by the VectorVest software. Therefore, you can quickly get a picture of the company’s fundamental measurements with a few mouse clicks.
- Very Good VST Score: The VST Master Indicator ranks all stocks from high to low with those stocks with the highest VST scores at the top of the list. BRC’s VST is 1.29, which is above average, but not exceptional. Using VST enables subscribers to identify stocks that are performing much better or worse than the average, and BRC is clearly in the former camp.
In conclusion, BRC's solid metrics, including its recent rapid price acceleration to test a quintuple top, indicate the potential to finally break away to the upside and reach new all-time highs. A break below VectorVest's calculated stop price of $50.46 would suggest it's time to exit if you have a position.
Looking at the chart below, the recent 19-day price consolidation needs to break out to the upside to reach an all-time high. Even during a rough two weeks for the general market, BRC has demonstrated strong relative strength and has remained resilient. The earnings trend is on an upward trajectory, and the average daily trading volume of 443,000 shares provides a favorable low bid-to-ask price spread for traders. Additionally, its low 0.77 Beta means that its price is 23% less volatile than the general market, which is a significant advantage.
Therefore, consider placing this stock on your watchlist for a possible initial breakout above $57 and a potential move higher. However, exercise caution for now, as the Daily Color Guard is mildly bearish, and BRC's MACD crossed to the downside four days ago. Ensure that this signal reverses before taking any position.
If you decide to purchase the stock, make sure to place a stop-loss order at a level that you are comfortable with, below your purchase price, and certainly not lower than $50.46 (VectorVest's suggested level) or your preference based on your risk tolerance.
If you're not a VectorVest subscriber, consider the $9.95 30-day trial to confirm that both the VectorVest Daily Color Guard and BRC stock are giving bullish signals before taking action.


Want These Types of Insights at Your Fingertips so You Can Win More Trades?
Use VectorVest to Analyze any stock free. VectorVest is the only stock analysis tool and portfolio management system that analyzes, ranks and graphs over 18,000 stocks each day for value, safety, and timing and gives a clear buy, sell or hold rating on every stock, every day.
Before you invest, check VectorVest! Click here to ANALYZE ANY STOCK FREE and see our system in action!


Leave A Comment