
by Leslie N. Masonson, MBA
Delta Air Lines, Inc. (DAL), is a NYSE-listed firm founded in 1928 with headquarters in Atlanta. As one of the world’s largest airlines, it offers over 300 destinations with a workforce of 95,000, revenues of $51 billion, and a market cap of $28.7 billion. The firm provides global airline passenger and cargo service using a fleet of 1,250 planes. The stock is a component of the S&P 500 and the Consumer Discretionary sector which has risen 32.2 % so far in 2023 while DAL has increased 35.7%. The stock has a solid Wall Street following with 1,320 institutions owning 70% of the outstanding shares, but no mutual fund holds more than 3% of the stock. The Vanguard Group owns 11.4% with over 8% in its ETF offerings.
Airlines and cruise ships are enjoying a passenger resurgence in demand and profits, as individuals are enjoying their freedom after being cooped up due to the Pandemic. However, business airline passengers which accounted for 50% of airline revenue, have not come back in full force due to company mandates and optional meeting arrangements requiring no travel such as using Zoom for client and intercompany meetings. Thus, the previous demand for expensive business and first-class seats has deteriorated and is not generating the revenue it once did.
Nevertheless, retail passengers are packing plans this Summer driving up the revenue. However, demand may contract in the Fall and Winter months. So, investors need to pay close attention to earnings reports going forward. DAL has had an increasing earnings picture in the past few quarters, as illustrated in the accompanying chart. DAL is the top airline industry performer according to the VectorVest analysis of their metrics of 29 airlines tracked.
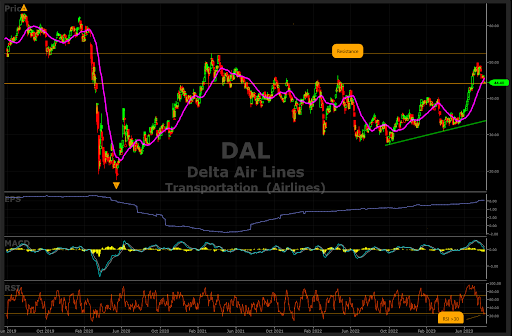
Let’s now view the chart once again. The stock price cratered from a high of $63.16 in July 2019, to $17.51 on May 13, 2020, then skyrocketed 200% to $52.50 on March 15, 2021. Then it went on a roller-coaster ride downhill culminating in its recent low on October 3, 2023, closing at $28.26. With additional volatility along the way, it reached a high of $49.75 on July 13 before giving back $5 to its Friday close of $44.55. The stock’s 5-year monthly Beta is 1.30, so overall it moves 30% more than the market which is substantial, indicating its volatility. The stock trades an average of 11.6 million shares a day so it is very liquid with a low bid-to-ask spread.
DAL Has Mostly High VectorVest Scores, Is Undervalued, and Has Rebounded Significantly Since October 2022
VectorVest’s mostly above-average metrics for DAL are as follows:
- Excellent Upside Potential: The Relative Value (RV) rating focuses on a stock’s long-term, three-year price appreciation potential. The current RV rating for DAL is 01.49 which is significantly above average on a scale of 0.00-2.00. The current stock price is $44.59, while VectorVest places its value at $66.50, indicating a potential 50% upside if it attains that value.
- Fair Safety: The Relative Safety (RS) rating is based on the company’s business longevity, financial predictability/consistency, debt-to-equity ratio, and additional risk parameters, including price volatility. Its RS rating of 0.90 is below average, indicating above-average risk. So, this stock is not suited for conservative investors.
- Very Good Timing: The Relative Timing (RT) rating focuses on the price trend over the short, medium, and long term. The components include price direction, dynamics, and price magnitude of price changes over daily, weekly, quarterly, and yearly comparisons. DAL has a high RT rating of 1.25 compared to the average of 0.98 for all the stocks in the database which means that the stock has been an above-average superior performer over multiple timeframes.
- Very Good Comfort Index: This index measures the consistency of a stock’s long-term resistance to severe and lengthy corrections. This index compares the individual stock to the fluctuation of the VectorVest Composite price measured on a scale of 0 to 2.00 at a level of 1.25, DAL’s rating is well above average
- Excellent Earnings Growth Rate (GRT): DAL’s current sales growth over the last 12 months is 13%, with an accompanying positive 28% forward-looking growth rate which is both strong. The latter is measured over a forecasted three-year period. As these important fundamental factors are captured in the VectorVest software, you can quickly get a picture of the company’s fundamental measurements with a few mouse clicks.
- Very Good VST Score: The VST Master Indicator ranks 9,137 stocks from high to low and brings stocks with the highest VST scores to the top of the list. DAL’s VST is 1.22, which is above average. Using VST enables subscribers to identify stocks that are performing much better or worse than average, and DAL is clearly in the former category.
To sum up, the metrics reviewed above provide a positive picture of DAL going forward, but only for aggressive investors and traders with a tolerance for above-average price volatility. Unquestionably, DAL has had strong recent price performance (see chart below) since March 24, and especially since its May 31 breakout above its three-month trading range, with the price zooming up from $25 to nearly $50 on July 13, before giving back $5.50 in the last two weeks.
If you are considering DAL for a purchase, be aware that the current price of $44.59 sits under a quintuple resistance level at $46 since May 2020. Notice that the RSI has moved above 30 which is a positive sign of a possible bottom, Therefore, it makes sense to place the ticker on a Watchlist and make sure it breaks above that level, and especially the $50 marker hit two weeks ago.
At that point, it should be a clear shot to hit the July 16, 2019 high of $63.16, as long as the market is still in an uptrend. Therefore, make sure DAL is rated a “Buy” and the VectorVest market timing signal confirms that the market is on a ‘Buy”, as well.
Now is a good time to take a 30-day trial to VectorVest, if you don’t currently subscribe, as August and September are historically the two worst-performing months of the year, and you don’t want to be going long if the market is tanking.


Want These Types of Insights at Your Fingertips so You Can Win More Trades?
Use VectorVest to analyze any stock free. VectorVest is the only stock analysis tool and portfolio management system that analyzes, ranks and graphs over 18,000 stocks each day for value, safety, and timing and gives a clear buy, sell or hold rating on every stock, every day.
Before you invest, check VectorVest! Click here to ANALYZE ANY STOCK FREE and see our system in action!


Leave A Comment