On Thursday, September 28, LNG had a huge up day with a $10.60 gain (6.95%) after hitting an intraday low of $147.70 on September 26. The high for the year was on September 14 at $178.62. The closing price pierced its 50-day moving average and closed well above it. Over the past year, energy-related stocks have been the leading sector of the 11 S&P 500 sectors. And LNG is among the leaders in that sector based on VectorVest criteria.
Cheniere Energy, Inc. is a Houston-based liquified natural gas producer founded in 1996. It operates terminals and develops, constructs, and operates liquefaction projects. In the earlier years prior to 2000, it focused on oil and natural gas, but since that time decided to focus only on liquified natural gas instead. That decision turned out to be the right one as natural gas is in high demand throughout the world. Consequently, its stock price has appreciated 16,388% from January 4, 1999, to September 28, 2022, compared to 362% for the S&P 500. Moreover, since the market lows of March 2020, the stock price has risen 391% compared to 58% for the S&P 500 Index.
Its next dividend payout date is November 7, 2022. The current cash dividend is $1.58 per share or 0.97% on a yield basis. The average stock in the VectorVest universe has a dividend yield of 1.22%, so LNG is below that level. LNG is a Russell 1,000 component and is traded on the American Stock exchange. The top institutional holders of this stock are Vanguard Group, Inc., BlackRock Inc, and FMR, LLC, together holding 50 million shares.
In general, VectorVest employs three proven metrics to assess the health of any stock: Relative Value (RV), Relative Safety (RS), and Relative Timing (RT). These are all measured on a scale of 0.00-2.00 – the higher the reading the better, with 2.00 being the maximum. VectorVest combines these metrics together in a “VST-Vector” rating for each stock in the database with the Vector formula from physics. It also provides a BUY, SELL or Hold recommendation.
Using VectorVest’s Chappell’s Champs search on the close of September 28, Cheniere Energy is listed as its top-ranked stock based on a combination of three criteria – VST (ranking of 1.56), CI (ranking of 1.67), and GRT (Earnings Growth Rate) of 47%. Moreover, LNG was the top-ranked stock in the Stock Viewer out of the over 9,100 stocks in the VectorVest universe. LNG trades an average 50-day daily trading volume of 2.7 million shares, so there is adequate liquidity to make trades.
With clear indicators cast onto a scale of 0.00-2.00, you can pick stocks with the highest VST ratings to win more trades. Here’s the current situation with LNG:
- High Upside Potential: The RV rating focuses on a stock’s long-term three-year price appreciation potential The current RV rating for LNG is a solid 1.85 – very close to the top of the scale of 0.00-2.00. Moreover, the stock is undervalued at the current price of $163.17. VectorVest’s current value for the stock is $232.02, or a price potential increase of 42% from current levels.
- High Safety: The RS rating is based on the company’s financial predictability/consistency, business longevity, debt-to-equity ratio, and additional risk parameters, including price volatility. The RS rating of 1.37 is above average, indicating a low risk.
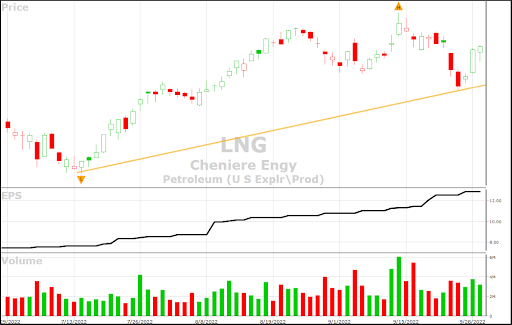
- Excellent Timing: Lastly, the RT rating focuses on the price trend over the short, medium, and long-term. The components include price direction, dynamics, and price magnitude of price changes over daily, weekly, quarterly, and yearly comparisons. Viewing the chart of LNG, one can observe the overall uptrend and the recent resurgence from the lows of June 17, 2022, and again from September 26 (at $147.70). For the year-to-date the price has risen from $101.42 to $163.37, or a stellar gain of 61%. Further gains to exceed the highs of $178.62 on September 14 are on the radar. And a closing price above that level has no resistance as that was the all-time high.
- High Comfort Index: This index measures the consistency of a stock’s long-term resistance to severe and lengthy corrections. This index compares the individual stock to the fluctuation of the VectorVest Composite and is measured on a scale of 0 to 2.00. At a level of 1.67, clearly, LNG has an excellent rating.
- Excellent Earnings Growth Rate: LNG’s 47% growth rate is at the high end and is measured over a forecasted three-year period. This fundamental factor is calculated in the software so you don’t have to do the work. The chart highlights the uptrending earnings and price movement.
- High VST Score: The VST Master Indicator ranks over 9,100 stocks from high to low, and brings to the top of the rankings those stocks with the highest VST scores. LNG is a prime example of the value of using the VectorVest analysis software.
All things considered, is this a good time to get into LNG at a great value? The answer may surprise you – analyze Cheniere Energy stock free to get a clear buy, sell, or hold recommendation!


Want These Types of Insights at Your Fingertips so You Can Win More Trades?
Use VectorVest to Analyze any stock free. VectorVest is the only stock analysis tool and portfolio management system that analyzes, ranks and graphs over 18,000 stocks each day for value, safety, and timing and gives a clear buy, sell or hold rating on every stock, every day.
VectorVest advocates buying safe, undervalued stocks, rising in price. As for ADBE, it has good upside potential with very good safety. However, it also has a very strong downward price trend pushing the stock lower and lower.
Before you invest, check VectorVest! Click here to ANALYZE ANY STOCK FREE and see our system in action!


Leave A Comment