
John Deere stole the show this morning as one of the only companies to report earnings. Their fiscal fourth-quarter results came in and impressed analysts and investors alike – sending shares 7% higher than they opened this morning.
The farm equipment provider saw revenue of $15.54 billion, compared to estimates of $14.4 billion. Net income came in at $2.246B. Looking at specific segments within the company, everything was up:
- Production & Precision Ag: Net sales increase of 59% ($7.43B)
- Small Ag & Turf: Net sales increase of 26% ($3.54B)
- Construction & Forestry: Net sales increase of 20% ($3.37B)
- Financial Services: Net income increase of 2% ($232M)
- John Deere Capital Corporation: Net sales increase of 15% ($776M)
Looking ahead to the future, there is a lot to be excited about with John Deere. The company is hard at work on the automation front, seeking to create self-driving tractors. This is something farmers around the world have been asking for.
And John Deere has optimism for the year to come as well. CEO John May states that the farm fundamentals and fleet dynamics look very positive in 2023. Moreover, there will be an increased investment across the states in infrastructure – creating additional demand for John Deere equipment.
The company has been held back by parts shortages as a result of the COVID-19 pandemic – something that auto, tech, and many other industries experienced. But now, supply-chain constraints appear to be in the rearview mirror – at least, for the time being.
As a result of all this, executives at John Deere have provided a strong outlook for 2023. They expect net income to grow to somewhere between $8-$8.5 billion, up from the $7.13 billion they reported this year. They’re also looking for an EPS growth of at least 11.4%.
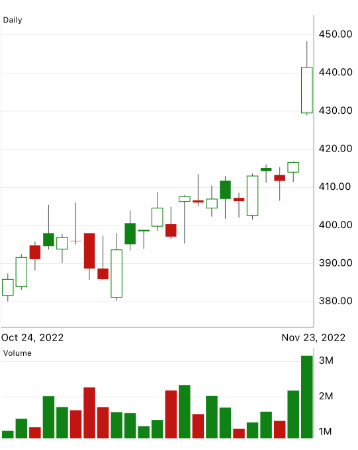
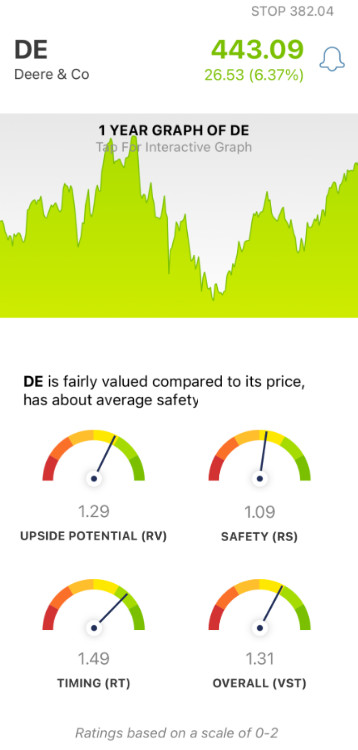
But just looking at DE stock from a trading perspective, is there still room for an opportunity here? Some experts suggest that the stock has moved just outside the “buy” range. The stock sits at its highest point in the last five years, now at $443/share.
If you want sound advice on what your next move with DE should be, keep reading – we’ll analyze the stock through VectorVest’s stock forecasting software.
Very Good Upside Potential & Excellent Timing for DE Stock
The VectorVest system simplifies stock analysis and makes it easy to execute decisions with confidence. You can learn everything you need to know about a stock based on three easy-to-understand ratings: relative value (RV), relative safety (RS), and relative timing (RT).
These ratings sit on a scale of 0.00-2.00, making it easy to interpret results. The higher the number, the better performance the stock is showing in a given category. But the best part is that based on the culmination of these ratings, VectorVest provides you with a clear buy, sell, or hold recommendation for any given stock, at any given time. Here’s what the system shows for DE right now:
- Very Good Upside Potential: The long-term price appreciation potential for DE stock 3 years out is promising. VectorVest provides a very good RV rating of 1.29. Moreover, the stock is fairly valued at its current price point.
- Fair Safety: An indicator of risk, the RS rating analyzes a stock’s financial consistency and predictability, debt-to-equity ratio, and business longevity. Right now, the RS rating of 1.09 is fair for DE stock – just above the average.
- Excellent Timing: In looking at the price trend for DE stock, VectorVest deems the timing to be excellent with an RT rating of 1.49. This is calculated based on the direction, dynamics, and magnitude of the stock’s price movement. VectorVest looks at price trend day over day, week over week, quarter over quarter, and year over year.
All this considered, the overall VST rating for DE is very good at 1.31. Does that mean there is still room for investors to buy at the current price? Or, should you wait for the noise to die down a bit and enter your position at a more favorable price point?
You don’t have to play the guessing game or let emotion influence your decision-making. Get a clear buy, sell, or hold recommendation by analyzing any stock for free at VectorVest.


Want These Types of Insights at Your Fingertips so You Can Win More Trades?
Use VectorVest to Analyze any stock free. VectorVest is the only stock analysis tool and portfolio management system that analyzes, ranks and graphs over 18,000 stocks each day for value, safety, and timing and gives a clear buy, sell or hold rating on every stock, every day.
VectorVest advocates buying safe, undervalued stocks, rising in price. As for DE, it is fairly valued with very good upside potential, fair safety, and excellent timing.
Before you invest, check VectorVest! Click here to ANALYZE ANY STOCK FREE and see our system in action!


Leave A Comment