
Tuesday morning Burlington Coat Factory (BURL) issued its 3rd quarter earnings report. Results for the quarter that ended October 29, 2022, were lackluster, to say the least – with a decrease in total sales, gross margin, and other key categories.
And yet, shares of BURL were trading 20% higher as of 6:30 AM this Tuesday morning, but have leveled out around 15%. Why is that? Company executives issued a very positive outlook for the future, which has investors excited. But is this hype substantiated? We’ll help you find out. Let’s take a look at the earnings report itself first.
In macroeconomic conditions where consumers are more cautious, it would seem to be no surprise that Burlington Coat Factory’s sales suffered in the fiscal 3rd quarter. They decreased by 11% from this period last year. However, CEO Michael O’Sullivan said that because the company operates with an off-price model, they should have fared better in these economic conditions.
Sales weren’t the only figure that suffered, either. The gross margin dropped slightly to 41.4% from 42.1%. This 0.2% drop came as a result of increases in merchandising & product sourcing costs – and it could have been worse had there not been an improvement in freight expenses.
One of the only areas of improvement for Burlington was net income – which grew $3 million (or $0.06/share) from the previous year. But this is not what has investors flocking to BURL stock – rather, it’s the upbeat sentiment for 2023 issued along with today’s earnings report.
O’Sullivan believes that the company is set up well to drive more sales at a higher margin and start recovering some of the losses they’ve faced in recent quarters. Moreover, he expects economic conditions to continue favoring off-price companies like Burlington.
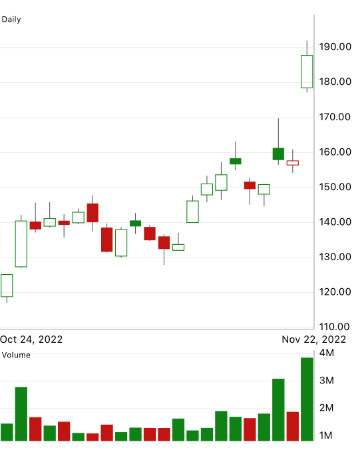
Looking back at the past year period, BURL stock is down over 32%. There has been a rally in the past 3 months though, as the stock turned a corner in September & October. In just the past month, the stock has climbed over 50%.
So – as an investor, is this a good time to hop aboard the ride to the top? Or, is it still too early to tell if this price trend will continue? Through the VectorVest stock analysis system, we’ve identified 2 important stock ratings you’ll need to weigh before making your decision. Keep reading to find out…
Very Poor Upside Potential vs Excellent Timing – Which Outweighs the Other?
The VectorVest system changes the way you uncover and analyze opportunities in the stock market. You can learn everything you need to know to make sound investment decisions with just three simple ratings: relative value (RV), relative safety (RS), and relative timing (RT).
These ratings sit on a scale of 0.00-2.00 – with 1.00 being the average. Anything over the average indicates overperformance and vice versa. And based on the average of these three ratings, VectorVest can provide you with a clear buy, sell, or hold recommendation – no guesswork or emotion clouding your judgment ever again! As for BURL, here’s the current situation:
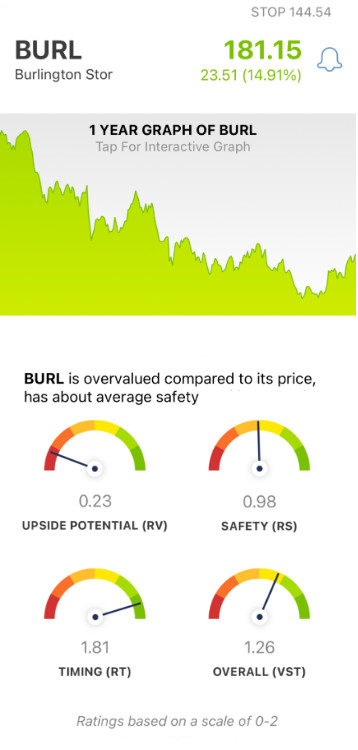
- Very Poor Upside Potential: Despite the optimistic outlook from BURL’s CEO, VectorVest deems the long-term price appreciation potential for this stock to be very poor – the RV rating of 0.23 reflects that. Moreover, the stock is already overvalued at its current price of $181.15 – the current value is $35.13.
- Fair Safety: An indicator of risk, the RS rating of 0.98 is just fair for BURL. This rating takes into account the financial consistency and predictability of a company, along with their debt-to-equity ratio and business longevity.
- Excellent Timing: As you can see by looking at BURL’s price movement in the past few months – and especially the past 24 hours – there is excellent timing right now, and the RT rating of 1.81 confirms that. This rating is based on a deep analysis of the direction, dynamics, and magnitude of a stock’s price movement. It factors price movement day over day, week over week, quarter over quarter, and year over year.
The overall VST rating for BURL works out to 1.26. So – does the excellent timing for BURL outweigh the very poor upside potential – or is it the other way around? We can provide you with a clear answer, so you don’t have to play the guessing game or let emotion influence your decision. Get a free stock analysis here to learn more.


Want These Types of Insights at Your Fingertips so You Can Win More Trades?
Use VectorVest to Analyze any stock free. VectorVest is the only stock analysis tool and portfolio management system that analyzes, ranks and graphs over 18,000 stocks each day for value, safety, and timing and gives a clear buy, sell or hold rating on every stock, every day.
VectorVest advocates buying safe, undervalued stocks, rising in price. As for BURL, it is overvalued with very poor upside potential, but it has fair safety and excellent timing.
Before you invest, check VectorVest! Click here to ANALYZE ANY STOCK FREE and see our system in action!


Leave A Comment