
Axcelis Technologies, Inc. (ACLS), founded in 1978 and based in Beverly, MA, is a leading designer and manufacturer of semiconductor equipment. Moreover, its focus is on developing applications that support ion implantation systems, a critical step in manufacturing integrated circuits. According to their website, their company’s “..suite of ion implanters delivers the highest levels of precision, purity, and productivity with the lowest cost of ownership.”
The stock is listed on the Nasdaq exchange. Its revenue of $229.2 million as reported in its recent November 2 quarterly report was up almost 30% from the prior year, while net income rose 46%. Moreover, there was a systems backlog of $1.1 billion with bookings of $337.1 million. The outlook is strong with full 2022 revenue projected at $885 million. On November 17, The company announced that it has become a founding member of the Semiconductor Climate Consortium (SCC) of SEMI.
Since January 2013 semiconductor stocks have been red hot. Looking at the performance of semiconductor stocks from January 2, 2013, through November 17, 2022, SOXX is up 669.5%, while ACLS is up 1,295% and the S&P 500 Index gained 170.1%. Interestingly, in this negative stock performance year, while the S&P 500 is down 17.4%, and SOXX declined 31.0%, ACLS is up 4.65% indicating its momentum and outperformance.
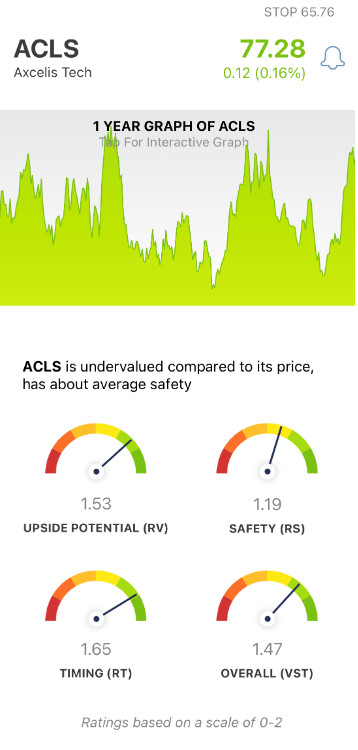
In the electronic semiconductor equipment sector which contains 43 stocks in the VectorVest database, ACLS is ranked number #1 with a VST rating of 1.47. Moreover, ACLS is in the electronic business sector containing 241 stocks and is also ranked #1 in that category as well. ACLS average daily trading volume 380,000 and it pays no dividend.
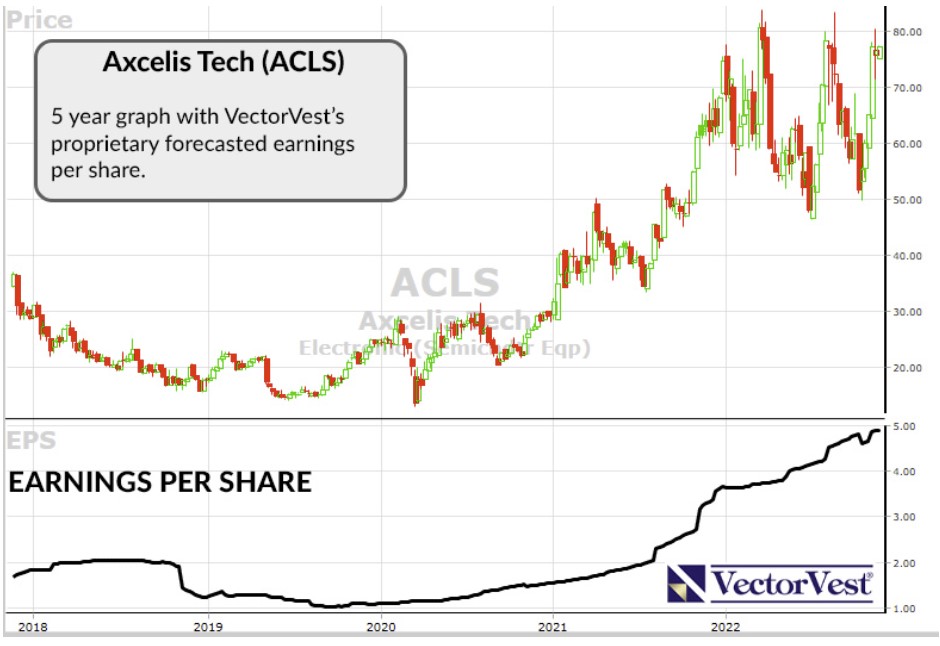
After its solid earnings report on November 2, the stock bolted to $80.24 on November 15 from a close of $59.84 on November 3, a rise of 34% in eight trading days. Its price is now hovering around $75 -$79 which is just short of its 2022 double top near $84. The question is whether it can break out to an all-time high or get dragged back down to the $50 level touched on July 5 (low for the year) and again around October 19. The VectorVest software will provide the insight needed regarding how to handle this dynamic company’s stock. The high for the year is $83.74 on March 22 and the low was on July 5 at $46.41.
VectorVest’s indicators, on a scale of 0.00-2.00, provide investors with the tools to be able to select stocks with the highest Value, Safety, Timing (VST) ratings to identify future winners, even in declining markets as we have now.
The VectorVest ratings on ACLS are as follows:
- Excellent Upside Potential: The Relative Value (RV) rating focuses on a stock’s long-term, three-year price appreciation potential. The current RV rating for ACLS is 1.53 – well above the 1.00 level on the scale of 0.00-2.00. Moreover, the stock is undervalued at the current price of $76.51 compared to VectorVest’s current value of the stock at $93.29.
- Good Safety: The Relative Safety (RS) rating is based on the company’s business longevity, financial predictability/consistency, debt-to-equity ratio, and additional risk parameters, including price volatility. The RS rating of 1.19 is above average, indicating a low risk.
- Excellent Timing: The Relative Timing (RT) rating focuses on the price trend over the short, medium, and long-term. The components include price direction, dynamics, and price magnitude of price changes over daily, weekly, quarterly, and yearly comparisons. ACLS has an above-average RT rating of 1.65. As the accompanying chart shows, ACLS hit a new all-time high a few weeks and is above its 50-day moving average!
- Excellent Earnings Growth Rate (GRT): ACLS’s 32% forecasted growth rate is well above average and is measured over a forecasted three-year period. This fundamental factor is calculated in the VectorVest software so you don’t have to do the work. Its chart highlights the up-trending earnings and price movement. It has a $4.90 earnings per share.
- Excellent VST Score: The VST Master Indicator ranks nearly 9,200 stocks from high to low and brings to the top of the rankings those stocks with the highest VST scores. ACLS score is 1.47 and is an example of the value of using the VectorVest analysis software to find the cream of the crop with a few mouse clicks.
All things considered, is this a good time to buy ACLS as it is approaching a quadruple top? To get the answer you can analyze ACLS free using VectorVest to get the current buy, sell or hold recommendation.


Want These Types of Insights at Your Fingertips so You Can Win More Trades?
Use VectorVest to Analyze any stock free. VectorVest is the only stock analysis tool and portfolio management system that analyzes, ranks and graphs over 18,000 stocks each day for value, safety, and timing and gives a clear buy, sell or hold rating on every stock, every day.
Before you invest, check VectorVest! Click here to ANALYZE ANY STOCK FREE and see our system in action!


Leave A Comment