
Fabrinet’s stock price has been on a roll since its low last October. With a good earnings track record over the past five years, now may be the time to consider a position based on the latest earnings report and your analysis of all the key factors which VectorVest can provide with a few mouse clicks. At the market close today, Fabrinet is announcing its second quarter 2023 financial results for the quarter ending December 30, 2022, so make sure to view the results as part of your due diligence if you are considering the stock for purchase. This Monday’s after the close announcement will move the stock, so it is best to wait until the release. Moreover, there will be a management conference call and webcast at 5:00 p.m. ET to review the results. Check it out here: https://investor.fabrinet.com/events-and-presentations/events
Fabrinet (NYSE: FN), incorporated in 1999 is based in George Town, Cayman Islands and is in the manufacture of complex electronic components including advanced optical packaging and precision optical equipment as well as electro-mechanical and electronic manufacturing services to OEMs. Industries using its products include aerospace, automotive, industrial, lasers, medical and optical. Fabrinet maintains engineering and manufacturing resources and facilities in the U.S., North America, the Asia-Pacific, and Europe.
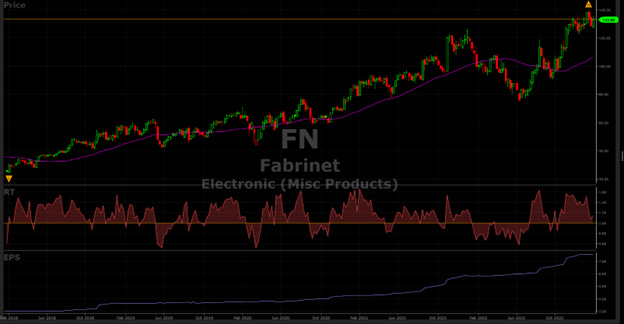
The company’s current market-cap is $4.88 billion with its fiscal year ending in June 2023. Revenue is $2.3 billion, and the company employs over 14,000 individuals. Since the stock’s recent low price of $91.08 on September 26, 2022, FN has gained 46.1% vs. 13.2% for the S&P 500, quite a sparkling performance. The stock has been in a trading range of $125 to $138 since November 22 and appears ready to take out the all-time closing high on January 17 of $137.92 but may fall below the 40-dma if the market tanks going forward.
And its Relative Timing (RT) since early August 2022 has placed it in the upper echelons of all the VectorVest stocks. FN is ranked third in VectorVest’s electronics miscellaneous products sector out of 75 companies based on its VST rating (explained below). Moreover, FN sports an average daily trading volume of nearly 171,000 shares. And it pays no annual dividend which may be a turn-off for dividend conscious investors. Options are available on the stock, although the daily volume and open interest is low. Currently, 387 institutions own the shares, but surprisingly only 0.50% of insiders own shares which are not an enthusiastic endorsement.
Exceptional VectorVest Scores Are at Positive Going Forward
The VectorVest ratings of FN are as follows:
- Excellent Upside Potential: The Relative Value (RV) rating focuses on a stock’s long-term, three-year price appreciation potential. The current RV rating for FN is 1.50 – solidly above the 1.00 level on a scale of 0.00-2.00. VectorVest’s current value of the stock is $175.13 well-below to its current price of $132.10; therefore it is considered undervalued, with room to run on the upside.
- Excellent Safety: The Relative Safety (RS) rating is based on the company’s business longevity, financial predictability/consistency, debt-to-equity ratio, and additional risk parameters, including price volatility. The RS rating of 1.43 is well above average, indicating minimal risk.
- Good Timing: The Relative Timing (RT) rating focuses on the price trend over the short, medium, and long term. The components include price direction, dynamics, and price magnitude of price changes over daily, weekly, quarterly, and yearly comparisons. FN has a slightly above average RT rating of 1.11. As the accompanying chart shows, FN closed on Friday just $7below its recent multi-year high on January 17, and it is just about holding above its 40-day moving average.
- Fair Comfort Index: This index measures the consistency of a stock’s long-term resistance to severe and lengthy corrections. This index compares the individual stock to the fluctuation of the VectorVest Composite price that is measured on a scale of 0 to 2.00. At a level of 1.01, FN has an average rating. This may not be a stock suitable for long-term conservative investors.
- Excellent Earnings Growth Rate (GRT): FN’s 21% forecasted growth rate is well above average and is measured over a forecasted three-year period. This fundamental factor is calculated in the VectorVest software, so you don’t have to do the work. Its 5-year chart highlights the up-trending earnings with an accelerating move higher since mid-August 2022, with forecasted earnings per share of $7.53 with an average P/E ratio of 17.54, well below the P/E ratio of 47.58 for all the VectorVest database stocks.
- Very Good VST Score: The VST Master Indicator ranks nearly 9,200 stocks from high to low and brings to the top of the rankings those stocks with the highest VST scores. FN’s score is 1.34 which is better than the majority of stocks in the database. Using VST enables users to determine stocks that are acting better than average, as well as the opportunity to find the cream of the crop with a few mouse clicks.
Considering the high VectorVest scores, is this a safe time to buy FN, as it is hovering just above its 40-day moving average, or is it about to give back some of its recent gains before its next move higher? Check out VectorVest’s buy, sell, and hold rating on this stock before making any move along with the recommended stock price. To see the FN rating you can analyze FN free using VectorVest to get the recommendation.


Want These Types of Insights at Your Fingertips so You Can Win More Trades?
Use VectorVest to Analyze any stock free. VectorVest is the only stock analysis tool and portfolio management system that analyzes, ranks and graphs over 18,000 stocks each day for value, safety, and timing and gives a clear buy, sell or hold rating on every stock, every day.
VectorVest advocates buying safe, undervalued stocks, rising in price. Right now, FN is currently undervalued and has well above average safety. But is it rated to buy?
Before you invest, check VectorVest! Click here to ANALYZE ANY STOCK FREE and see our system in action!


Leave A Comment